dealer network management platformdealer network management best practicesdealer network quality control software
Dealer Network Management Platform: What Head Office Should Expect to See
What head office should expect from a dealer network management platform: drill-down dashboards, monthly regional quality views and tracked corrective actions.
Dealer Network Management Platform: What Head Office Should Expect to See
By Naseef Umar, Founder and CEO of AutoSmart, with over a decade of experience across automotive operations, dealer standards, network performance and audits. Disclosure: the author runs AutoSmart, which makes AutoSmart Audit, a product mentioned in this guide.
A dealer network management platform is a system that gives head office one live view of dealer compliance, quality and corrective actions across every site, so network performance is read from current data instead of rebuilt by hand each month.
The network you oversee is probably large. NADA reports that 16,991 franchised light-vehicle dealers wrote more than 136 million repair orders in the first half of 2026 (NADA, 2026). Past 100 sites, spreadsheets, email and WhatsApp stop telling you who is compliant. This guide sets out what head office should expect to see, how to test it in a demo, and what larger networks do differently. It builds on our look at when spreadsheets break down.
Key Takeaways
A dealer network management platform should give head office live compliance scores, a drill-down from network to finding, and corrective actions tracked to closure.
A drill-down dashboard is best tested live: ask a vendor to take one red regional number down to its causes in under three clicks.
Dealer networks that scale use one weighted scoring standard, scheduled evaluation cycles and closed-loop corrective actions instead of spreadsheets.
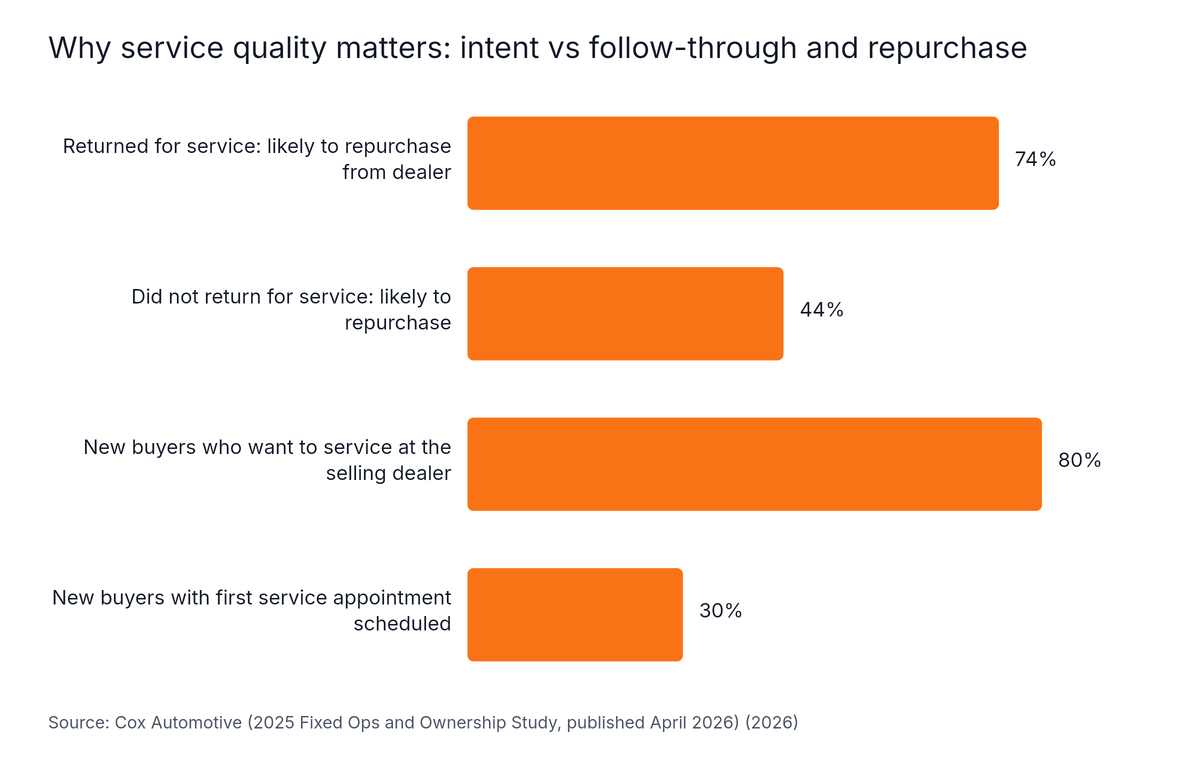
Cox Automotive's April 2026 ownership study (Cox Automotive, 2026) found 74% of buyers who returned for service were likely to repurchase, against 44% who did not. That is a survey correlation, not proof that a monthly view changes repurchase.
What should a dealer network management platform give head office?
A dealer network management platform should give head office four things: current compliance scores for every site, a drill-down path from network to individual finding, corrective actions tracked to closure, and a monthly view that needs no manual consolidation. In the 2026 Urban Science Harris Poll, 53% of US OEM dealers said brand compliance requirements are difficult to keep up with (Urban Science, 2026).
Here is the practical test. Can the person who owns the board deck answer "Where are we performing well? Where are we failing? Which dealers need attention?" without opening a spreadsheet? If not, the process is a reporting exercise, not a management tool.
The four things to expect
Live compliance scores. Every audit is scored on submission, using one weighting applied identically to every auditor and site. That makes region-to-region comparison defensible.
A drill-down path. Head office moves from network to region, dealer, pillar and finding, with evidence attached at the bottom.
A closed loop. Each non-compliance becomes a corrective action: a tracked task with a Person-In-Charge (PIC), a due date and closure evidence. Without that, a finding is only a line in a report.
No manual consolidation. Aggregate performance is available without anyone downloading exports and merging them by hand.
The cost of skipping the third item is easy to see. Each audit typically produces 8 to 20 findings. AutoSmart's own research into manual audit processes shows a single finding can need 4 to 5 follow-ups, including escalations, before closure. The audit team ends up as the chasing team.
How is it different from a dealer management system?
A dealer management system (DMS) is the software a single dealership runs its sales, service, parts and accounts on. A network platform sits above many dealerships. The DMS records transactions. The network platform measures whether each site meets the standard. Buyers often blur the two, so name the category you are shopping in before any demo. For a closer look at standards measurement, see dealer performance audits.
What should a drill-down dashboard show, and how do you test it in a demo?
A drill-down dashboard is a management view that lets head office move from one network score to region, dealer, pillar and individual finding, ending at the evidence photo. Test it by asking the vendor to take one red regional number down to its causes in under three clicks, live, on your own data.
A single national score is a useful contrast. J.D. Power's March 2026 U.S. Customer Service Index study reports dealer service satisfaction up 3 points to 868 (J.D. Power, 2026). One headline figure like that tells you the direction of a market, not which of your regions slipped. The table below sets out the chain a head-of-network buyer needs instead.
Level
Question head office asks
What the screen should show
Network
Are we trending up or down against target?
Overall score, trend line, exceptions only
Region
Which regions are dragging the average?
Regional ranking, heat map, change since last cycle
Dealer
Which sites need attention first?
Site score, chronic failures, open actions
Pillar
Is it sales, aftersales, safety or customer experience?
Score by standard section
Finding
What exactly failed, and who owns the fix?
Question, evidence photo, owner, due date, status
Most "real-time" claims are vendor assertions, so watch the screen rather than the slides.
A four-step demo test
Ask for your own data. Load a sample of your real checklist and sites, not a polished demo account.
Pick a red number. Choose the weakest region and drill down. Count the clicks.
Check the evidence. Ask whether the photo carries a date, time stamp and geotag, and whether old images can be uploaded.
Trace the action. Open one failed item and confirm it has an owner, a due date and a status.
We are about to double our network and our current process will not scale: what do larger networks do differently?
Larger dealer networks replace spreadsheet-and-email coordination with one scoring standard, scoped user roles, scheduled evaluation cycles and tracked corrective actions. The pressure is real: 45% of OEM executives expect fewer dealers in five years, up from 33% in 2025 (Dealership Guy, July 2026), which means fewer, bigger partners to oversee.
Only 14% of those executives expect to add dealers (just-auto, July 2026). Doubling a network does not double the field team, so the work has to move from people to a system. Networks that cope tend to do five things.
Configure the standard once. Weighted scoring is set up in the platform and applied identically across every auditor and site, so a disputed score has a defensible answer.
Scope access by role. Auditors see only their dealerships, external auditors get restricted permissions, and management gets read-only views.
Run scheduled evaluation cycles. An evaluation cycle is a recurring audit window, such as monthly or quarterly, that groups audits into comparable periods so trends can be measured over time.
Shift suitable checks to self-assessment. A self-assessment is a structured check the dealership completes itself, which head office then compares with independent audits.
Close the loop on every finding. Automated reminders and closure evidence replace email chasing.
What changes operationally
Area
Manual process at 100+ sites
Platform process
Scoring
Excel calculations per audit
Automatic on submission
Evidence
Photos pasted into PowerPoint
Captured live and attached to the finding
Reporting
Several hours per cycle consolidating
Aggregate view without manual steps
Follow-up
4 to 5 chases per finding
Reminders and closure evidence
Site visits
Physical for every check
Self-assessment where suitable
The strain shows on the dealer side too: 82% of dealers say their networks need a simpler way to manage brand contracts (Urban Science, 2026). Complexity compounds as sites are added.
Our data: These are AutoSmart's own reported figures, not independently verified, with no sample size stated. AutoSmart's customer data shows audit cycles reduced from 10 days to 3 days. Its best reported result is a 70% reduction, in audit cycle or reporting turnaround (the exact metric is not specified).
Travel is the other lever. AutoSmart estimates an average of $500 per physical visit, so every 100 visits represents about $50,000 in direct travel cost. It estimates that moving suitable checks to self-assessment could cut physical visits by 30 to 40%, saving roughly $15,000 to $20,000 per 100 visits. Go-live with AutoSmart Audit is typically 5 to 10 working days once configuration inputs are shared. For field-side detail, see mobile audit software for dealer networks.
Quality varies wildly between our regions and we only find out at year end: what would give us that picture monthly?
A monthly regional quality picture comes from running audits in scheduled evaluation cycles, scoring every site on one weighted standard, and rolling results up by region automatically. The stakes are visible in Cox Automotive's April 2026 study: 74% of buyers who return to the dealer for service are likely to repurchase, against 44% of those who don't (Cox Automotive, 2026).
That is a correlation in survey data, not proof that a monthly view changes repurchase. It does show why weak regional service is worth catching early. Cox Automotive estimates more than $12,000 of potential lifetime service spend is lost with each service customer a dealer loses (Cox Automotive, 2026). Waiting for year end means a weak region can lose customers for 12 months before anyone sees it.
Agree a fixed set of 8 to 10 measures, a data source for each and a refresh cadence. A starting structure:
Measure
Typical source
Refresh
Overall compliance score by region
Audit scores
On submission, reviewed monthly
Chronic failures (same standard, repeat cycles)
Historical cycle data
Each evaluation cycle
Open and overdue corrective actions
Action tracking
Live
Self-assessment vs independent audit gap
Self-assessments and audits
Each evaluation cycle
Aftersales and service quality measures
Audit pillars and customer feedback
Monthly
The board view should then show exceptions only: a regional heat map, a trend line against target, and links to the actions behind each red number.
Chart: Why service quality matters, repurchase and service intent (%), Cox Automotive 2025 Fixed Ops and Ownership Study, published April 2026.
Horizontal Bar chart: Why service quality matters: intent vs follow-through and repurchase. Highest: New buyers who want to service at the selling dealer at 80%.
Intent does not equal follow-through. Cox reports 80% of new-vehicle buyers say they are likely to return to the dealership for service, yet only about a quarter had the first service appointment scheduled at purchase (Cox Automotive, 2026).
Average dealer service and parts revenue reached about $9.23M in 2025, up 33% since 2018, while the dealer share of service visits fell from 33% to 29% (Cox Automotive, 2026). Revenue is rising while share slips, so local quality needs close tracking.
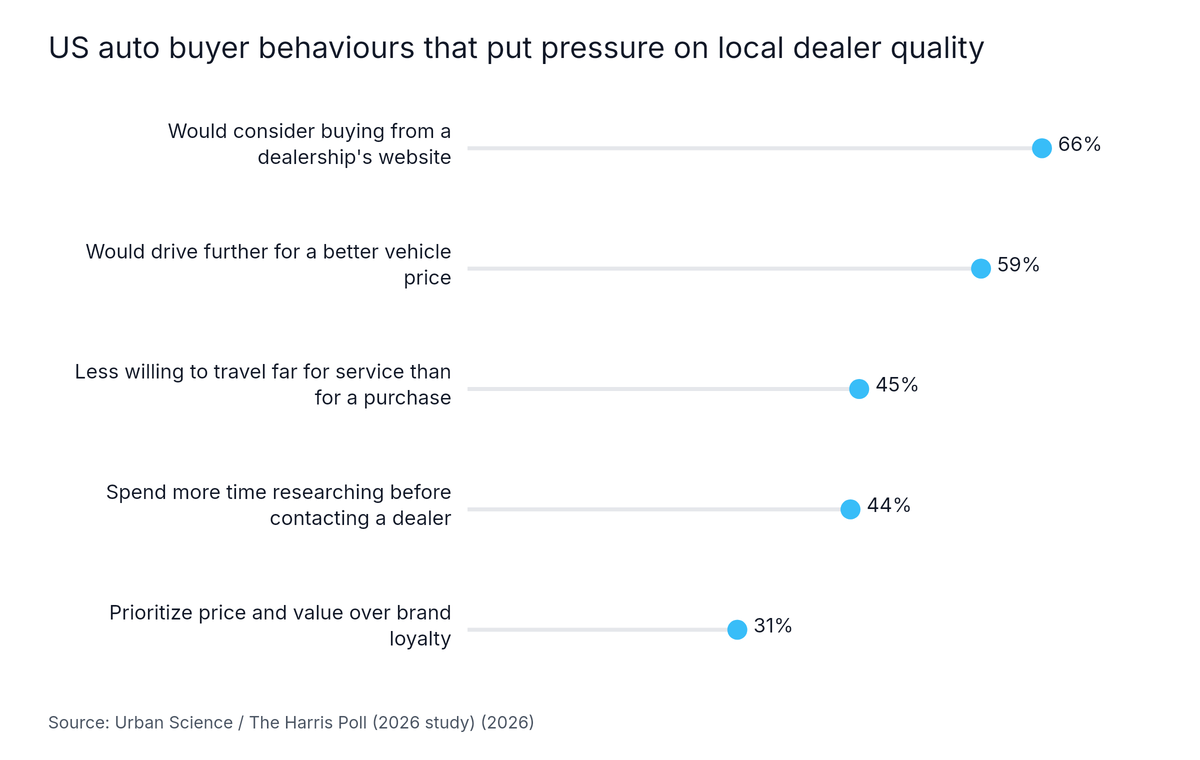
Buyer behaviour adds pressure at local level. In the May 2026 Urban Science Harris Poll, 45% of US auto buyers said they are less willing to travel far for service than for a vehicle purchase (Urban Science, 2026). A weak site loses service customers to the nearest alternative. The chart below shows the other buyer behaviours in the same poll.
Chart: US auto buyer behaviours that put pressure on local dealer quality (%), Urban Science and The Harris Poll, 2026 study.
Lollipop chart: US auto buyer behaviours that put pressure on local dealer quality. Highest: Would consider buying from a dealership's website at 66%.
What should you ask a vendor before buying a dealer network management platform?
Ask any dealer network management platform vendor for five proofs: a live drill-down on your own data, scoring that reproduces your existing standard, offline field capture, corrective actions tracked to closure, and security certifications you can verify. Then ask for a written implementation plan and a reference site running at a similar scale.
The economic buyer carries the risk if auditors refuse to use the tool, so field adoption is the highest-leverage risk. Judge the product on site, not only in the boardroom.
Ask
A good answer
Red flag
Can you rebuild our standard exactly, including weightings?
Customer admin builds and revises checklists without vendor tickets
Custom development for every change
Does it work without signal?
Offline-first mobile app, with sync later
"Needs a connection"
How is evidence verified?
Live capture, date and time stamp, geotag
Gallery uploads accepted
How do findings get closed?
Owner, due date, reminders, closure evidence
Report export only
What security can we verify?
Named certifications such as ISO 27001, SOC 2 Type II and GDPR compliance
"Security is on the roadmap"
How long to go live?
Written plan with dates
Open-ended timeline
Check that multi-tier hierarchy support is a default rather than an add-on. Automotive network audit software explains what generic tools miss.
Who is a dealer network management platform not for?
A dealer network management platform built around audits is not for every business. It is a poor fit for a single dealership, does not replace a dealer management system, and cannot fix a network with no agreed standard. Adoption is the main risk: 53% of US OEM dealers say brand compliance requirements are difficult to keep up with (Urban Science, 2026), so a tool that adds work gets bypassed.
Some honest limits:
No standard, no score. If your OEM standard is still being written, finalise it first. A platform enforces a standard. It does not invent one.
Adoption needs early tests. Field teams who keep a parallel paper record make the platform's data worthless. Run the first two site visits with real auditors before committing network-wide.
It does not move transactions. Sales and finance feeds belong in the DMS.
Real-time claims need proof. Insist on seeing live data on your own network, not a slide.
Frequently Asked Questions
What is the difference between a dealer network management platform and a dealer management system?
A dealer management system (DMS) runs one dealership's sales, service, parts and accounts. A dealer network management platform sits above many dealerships and gives head office a single view of compliance, quality and corrective actions across the whole network. The two are complementary: the DMS holds transactions, while the network platform measures standards.
How often should dealer network performance data be refreshed?
Refresh each type of data at its natural cadence. Audit scores should update as soon as an audit is submitted, corrective-action status should update as owners respond, and board-level summaries should be reviewed monthly. Real-time visibility means head office never waits for someone to compile a report before seeing the current position.
How do you stop dealers feeling that reporting is an extra burden?
Remove duplicate work. Dealers accept reporting when scoring is automatic, evidence is captured once on a phone, and actions arrive with a clear owner and due date instead of an email chain. Structured self-assessments also let dealers complete suitable checks themselves, which reduces field visits and gives both sides the same record.
How long does it take to implement a dealer network management platform?
With AutoSmart Audit, go-live is typically 5 to 10 working days once the customer shares the required configuration inputs, such as checklists, scoring weights, users and site hierarchy. Timelines for other platforms vary, so ask every vendor for a written plan and a reference site running at similar scale.
What to do next
A dealer network management platform should do the arithmetic so head office can argue about performance instead. Expect live compliance scores on one weighted standard, a drill-down from network to finding, corrective actions closed with evidence, and a fixed monthly regional picture. With 45% of OEM executives expecting fewer dealers in five years (Dealership Guy, 2026), each remaining site carries more weight.
Test the drill-down on your own data in under three clicks.
Agree 8 to 10 monthly measures before any vendor demo.
Ask for written implementation plans and verifiable security certifications.
Compare your current process with franchise compliance software approaches that keep standards visible without constant travel. When you're ready to see a drill-down on your own network, Schedule a Free Demo.
Written by
Naseef Umar
Founder | CEO
Naseef Umar is an automotive industry expert and the Founder & CEO of AutoSmart, with over a decade of experience working across automotive operations, dealer standards, network performance, audits, and digital transformation.
Company
KERALA Full Address - Pulikillam W Rd, Kakkanad West, Chembumukku, Edappally, Kochi, Kerala 682030; DUBAI Full Address - Dubai Silicon Oasis, UAE

 Naseef UmarNov 5, 2026