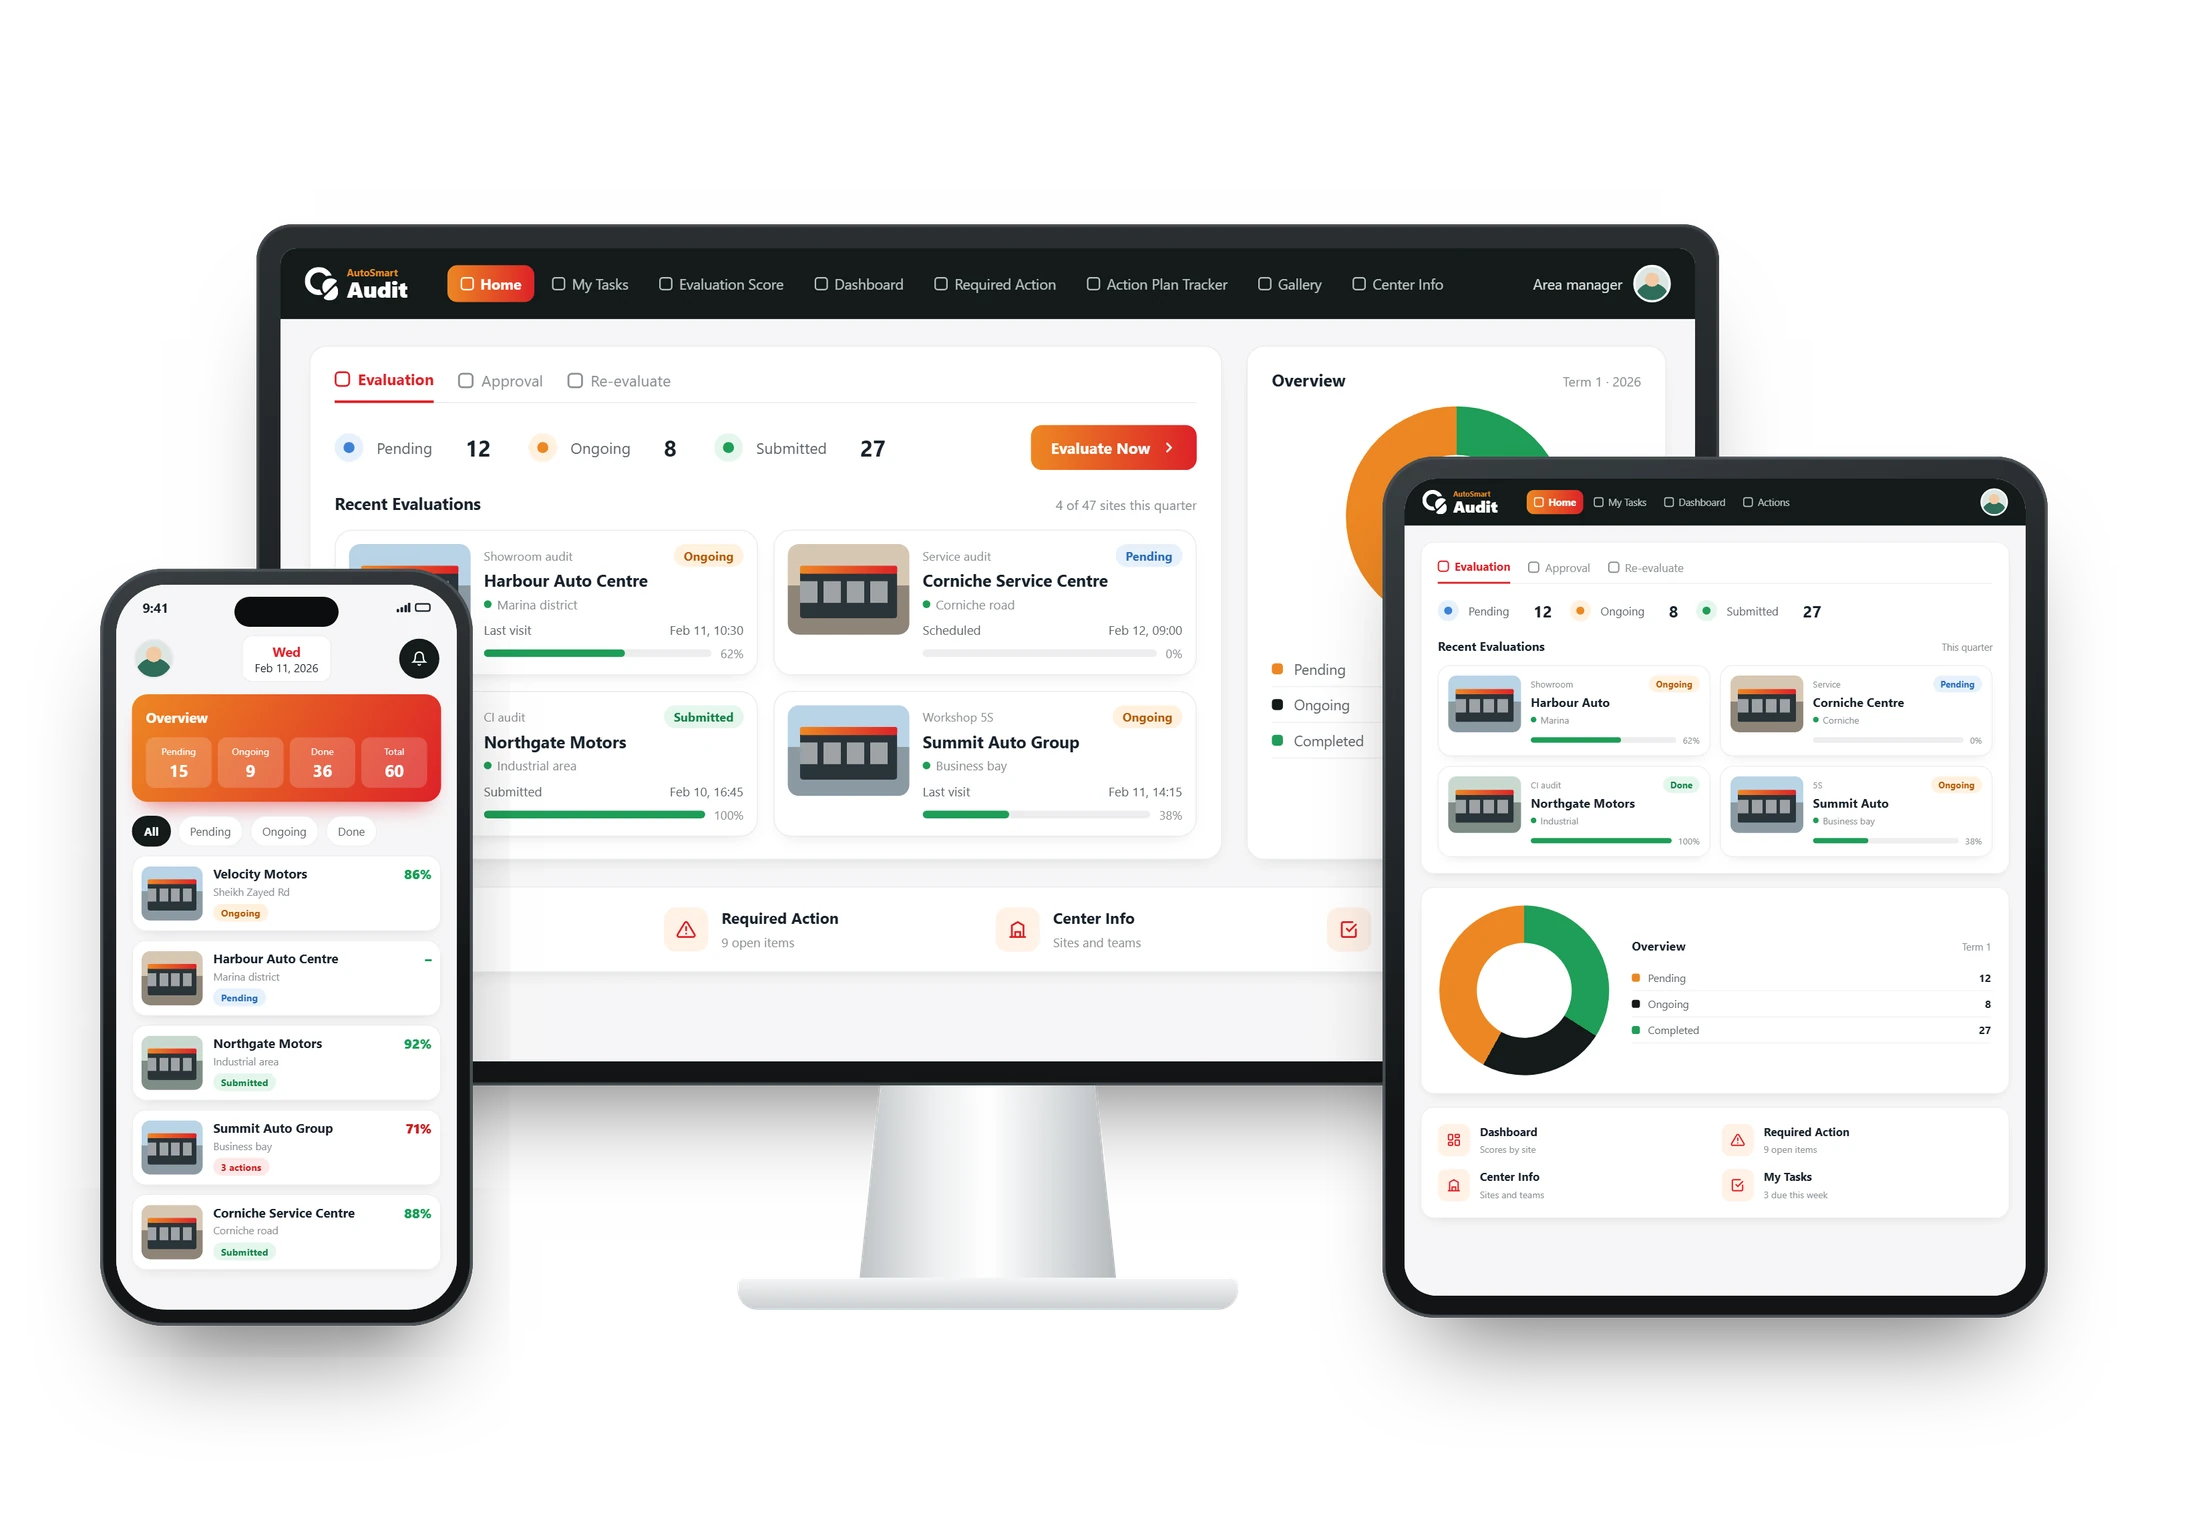


Drawing on published industry research and AutoSmart’s work with dealer-network leaders across two-, four- and commercial-vehicle brands in Asia, the Middle East and Europe.
The one-page version
The two-wheeler industry has never sold more vehicles, and its dealers have rarely been under more pressure. This paper argues that the way networks measure dealer performance is part of the reason.
India alone retailed more than 21 million two-wheelers in the last financial year, a record. Yet the country’s dealer body estimates that if service were assessed on its own, roughly seven in ten two-wheeler workshops would not be profitable, and independent research suggests that around four in five two-wheelers end up being serviced outside the authorised network once the warranty ends. Record sales, a service business that loses money, and a customer who leaves. That is the two-wheeler retail paradox.
Almost every two-wheeler brand now runs a structured dealer standards programme: outlets are visited, scored and ranked. In our experience across networks, those programmes are excellent at measuring how an outlet looks and much weaker at measuring how well it works. Amenities, signage and grooming routinely score in the high eighties and nineties. Repair process, workshop organisation and complaint closure typically sit in the sixties. Blended into one number, the result is a comfortable score that hides the gap the customer actually experiences.
~70%
of 2W workshops would be loss-making if assessed on their own (FADA, 2026)
~80%
of 2Ws serviced outside the authorised network after warranty (Ken Research)
<15%
of audit findings closed with evidence in many 2W networks (AutoSmart experience)
This paper makes four arguments:
- Dealer audits measure two different things and blend them into one score. A hospitality layer that brands have largely fixed, and an operational spine that they have not. The average hides the split.
- The checkpoints that predict whether a customer returns are the ones failing most and weighted least. Published satisfaction research and audit data point in the same direction.
- Where an outlet sits (main or branch, full-format or service-only, metro or small town) predicts its score better than anything the dealer does. One checklist for every format is grading the building.
- Networks are good at finding problems and poor at fixing them. The fix rate, not the score, is the number leadership should watch.
Each section ends with a practical takeaway. The final section is a 90-day plan that needs no new system to begin.
The two-wheeler retail paradox
More bikes than ever, thinner workshops than ever, and a customer who is only loyal until the warranty runs out.
Start with the scale. In the financial year to March 2026, India’s two-wheeler industry sold 21.7 million units domestically. That is the highest figure ever recorded, and more than four times the passenger-vehicle market.1 Two-wheelers are the volume backbone of automotive retail across South and South-East Asia, Africa and Latin America, and every one of those units enters a dealer network that must sell it, deliver it and service it for years afterwards.
Figure 1. India domestic vehicle sales by segment, FY2025-26. Source: SIAM.
Now look at the economics behind the volume. In September 2026, the Federation of Automobile Dealers Associations (FADA) said it would take two-wheeler workshop profitability to manufacturers directly. Its president put the problem plainly: dealers need roughly ₹500 of workshop revenue per vehicle to make service viable and currently average around ₹300; if sales and service were assessed separately, about 70% of two-wheeler workshops would not be profitable.2 Profitability and margins were the most-cited concern in FADA’s 2026 dealer satisfaction study, ahead of product, EV transition and OEM relationship.3
Then look at the customer. Aftermarket research estimates that once the warranty period ends, roughly 80% of two-wheelers are serviced at local garages rather than authorised workshops, and that authorised networks lose most of their customer base within three to five years of the sale.4 Independent operators compete on price, proximity and speed, and increasingly on convenience through doorstep service.
Put the three facts together. The industry is selling record volumes into a network whose service arm loses money and whose customers walk away as soon as they are free to. Anything that improves workshop retention improves dealer viability directly. That is why what a dealer standards programme chooses to measure matters far more than it looks.
The programme that measures the wrong thing
Almost every two-wheeler brand now runs a dealer standards or “premium outlet” programme. An auditor visits, works through a checklist of sixty to ninety questions, and produces a score out of 100. Outlets are banded, ranked by zone and region, and the results go into a quarterly review. The programmes are mature, well-funded and, in our experience, taken seriously by everyone involved.
They are also, in most networks, measuring presentation far more than performance. The rest of this paper explains why that happens, what it costs, and what to do about it.
Take this back to your network
Ask two questions of your last audit cycle. First: what share of the checklist is about how the outlet looks, versus how the work is done? Second: is your workshop retention rate anywhere on the dashboard? In most networks the answers are “most of it” and “no”.
Two layers, one score
A dealer audit is really two audits wearing one uniform. Once you see the split, you cannot unsee it.
Take any mature two-wheeler dealer checklist and sort its questions into two piles.
The first pile is the hospitality layer. Is the signage lit and undamaged? Is the lounge clean, with seating, a screen and water? Are staff in uniform? Was the customer greeted? Is there a delivery area with the ceremonial kit? Are refreshments available? These questions are about how the outlet looks and feels. They matter. They are also, in most networks, largely solved, because they are visible, they photograph well, and they have had a decade of brand investment behind them.
The second pile is the operational spine. Was a pre-delivery inspection done and recorded? Did a supervisor check the repair before the vehicle went back to the customer? Was the job allocated by skill? Did the technician follow the manual and use a torque wrench? Is there a system for the 8 a.m. rush? Are insurance and accident jobs tracked? Were complaints closed inside the target time, and did the same complaint recur? These questions are about whether the work is done right. They are invisible to a customer standing in the lounge, right up until the vehicle comes back with the same fault.
When we look at audit results across two-wheeler networks, the two piles behave completely differently.
Figure 2. Typical compliance range by audit area across two-wheeler networks. Illustrative, based on AutoSmart’s cross-network experience; ranges rounded.
Hospitality areas routinely score in the high eighties and nineties. Process areas (workshop organisation, repair discipline, complaint closure) typically sit in the sixties. Blend them and you get a number in the high seventies or low eighties. A respectable network. Comfortable.
Published customer research points the same way. J.D. Power’s India two-wheeler after-sales studies have repeatedly found that the industry executes its visible process standards well, yet satisfaction is driven by what happens around the repair: communication, diagnosis and the work itself.5 Networks are good at the parts of service the auditor can photograph.
Why the blend is the problem
When two very different things are averaged, the strong one masks the weak one, and nobody is quite sure which is which. A dealer principal looking at “80” sees a decent result and does not know that his workshop is at 62. A regional head looking at a top-band outlet assumes the workshop is top-band too. And the brand’s leadership team, looking at a network average, concludes that the standards programme is working.
In our experience across four-wheeler and commercial-vehicle networks, the ones that made real progress on service quality did one thing first: they separated the scores. Hospitality and process are reported side by side, never blended. An outlet can be excellent on presentation and failing on process, and everyone sees both.
The second thing they did was reweight. In most two-wheeler checklists, hospitality questions outnumber process questions roughly two to one, and each question carries equal weight. A missing accessory display costs an outlet as many points as a missing final inspection. That is not a sensible statement about what matters to a customer.
We had a dozen questions on the customer lounge and two on whether the repair was checked. When I put it that way to the board, the weighting changed in a week.
Head of Dealer Development, multi-brand two-wheeler group
Take this back to your network
Sort your own checklist into the two piles. Count them. Then ask: what is the score on each pile separately, and does the weighting reflect what actually brings a customer back? In most networks the answer to the second question is no.
The checkpoints that actually matter
If you only fixed eight things across your network, these would be the eight.
When you list the questions that the largest share of outlets fail, a pattern appears immediately. They are all workshop process. Not one is a lounge, a uniform or a signboard.
Figure 3. Share of outlets typically failing core workshop checkpoints in two-wheeler networks. Illustrative range based on AutoSmart’s cross-network experience.
Read that list as a customer would experience it.
- Pre-delivery inspection. The vehicle is sold without a documented check that it left the outlet in the right condition. The first service visit becomes a warranty visit.
- Supervisor sign-off. Nobody senior checks the job before release. Repeat repairs are the direct consequence, and repeat repairs are the single most damaging experience a workshop can deliver.
- Manual and torque adherence. Technicians work from memory. On a two-wheeler, incorrect torque on a handful of fasteners is a safety issue, not a quality issue.
- Diagnostic report shared. The diagnostic tool is either not used or its output is not given to the customer, who leaves without knowing what condition their vehicle is in.
- Rush-hour handling. The morning drop-off has no queue system, no tokens, no helper. Customers wait twenty minutes to hand over a key. It is among the most common negative themes in online reviews of two-wheeler service, and around half the network has no answer to it.
- Workshop zoning. Vehicles waiting for a job card, being repaired, waiting for washing and ready for delivery are all parked together. Nobody knows what stage a vehicle is at without asking around.
- Insurance and accident jobs. The longest, most complaint-prone jobs in the workshop are not tracked on a board. The customer calls; the service advisor guesses.
- Complaint recurrence. Complaints are closed, but nobody checks whether the same complaint came back. The root cause survives.
What the customer research says
These are not our preferences. They line up with what customers say drives their satisfaction. J.D. Power’s 2019 India two-wheeler study found that owners visiting for a specific repair rather than routine service were markedly less satisfied, and traced the gap to problem diagnosis, communication, repairs not meeting expectations and time management.6 The same study found scheduled customers far more satisfied than walk-ins, which is a direct measure of how well an outlet handles its flow.6
Figure 4. Satisfaction with two-wheeler after-sales service, India. Source: J.D. Power 2019 India Two-Wheeler Customer Service Index Study.
Every one of those drivers (diagnosis, repair quality, time management, scheduling) is an operational-spine item. None of them is a lounge.
Why these fail
When you read the reasons auditors record against failed checkpoints, the vocabulary is remarkably small. The most common reason, by a wide margin, is two words: “not available.” The board is not available. The tool is not available. The demarcation is not available. The person is not available.
Behind that phrase sit three real causes, and they need three different fixes.
- Space. Many two-wheeler workshops were built for a third of their current throughput. Six or seven parking zones cannot be demarcated in a workshop that has room for four. This is a facility investment conversation, not an audit conversation.
- People. Supervisor sign-off fails because there is no supervisor. Technician attrition in two-wheeler service runs well above four-wheeler, and every audit cycle finds a different team.
- Habit. A large share of failures are things that cost nothing: a diagnostic report not printed, a job card not signed, a board not updated. These are process habits that were never built, because nobody was checking the workshop the way they check the showroom.
Only the third cause is fixable by auditing harder. The first two need a different conversation between the brand and the dealer, and the audit’s job is to make that conversation specific.
Take this back to your network
Pull your own top-ten failed questions. If they are all workshop process, and they almost certainly are, put them in front of the service head, not the dealer development head. Then classify each failure as space, people or habit before deciding what to do about it.
See how networks put this into practice. AutoSmart runs dealer self-assessment with evidence, online verification, owned findings and live coverage on one platform.
Where you sit decides your score
One checklist, every outlet, every town. It sounds fair. The data says it is measuring the wrong thing.
Two-wheeler networks are unusually varied. The same brand is sold from a two-storey flagship in a state capital and from a single-bay branch on a highway junction. Both are audited on the same questions. When scores are split by outlet type, the results are not close.
Across the networks we have studied, branch outlets typically trail main outlets by five to ten points. Service-only outlets, with no showroom and just a workshop and a parts counter, trail full-format outlets by ten to fifteen. Small-town outlets trail metro outlets by around five. Between the best and worst regions in a single network, the spread is commonly twenty points or more.
Some of that is genuine performance difference. Most of it is not. A branch fails “dedicated finance staff, minimum two” because it has four employees in total. A service-only outlet fails every showroom question by definition. A small-town outlet fails the lounge standard because the lounge standard was written for metro footfall.
The effect is that the checklist grades the format, and the dealer, who chose the format years ago or inherited it, is told every quarter that he is in the bottom band.
What this does to behaviour
Nothing good. A dealer who cannot reach the top band no matter what he does stops trying to. We see it in corrective-action data: closure rates in small-town outlets are a fraction of those in metros. Not because small-town dealers care less, but because the list they are handed is longer, less achievable, and not written for them.
There is a second-order effect for the brand. If a quarter of the network is structurally unable to pass, the bottom-band count stops being a signal. It becomes noise that leadership learns to ignore, and a genuinely failing metro outlet hides inside it.
What leading networks do instead
The four-wheeler and commercial-vehicle networks that solved this did not write four checklists. They wrote one checklist with three things varied by format:
- Applicability. Questions that cannot apply to a format are removed from the denominator, not marked as failed. A service-only outlet is not scored on the showroom.
- Thresholds. The standard stays the same; the bar moves. A rush-hour system is mandatory everywhere, but “helper plus tokens plus queue lane” is the metro bar and “tokens” is the branch bar.
- Weighting. The operational spine is weighted identically everywhere, because a vehicle repaired badly in a small town is repaired just as badly. Hospitality weighting flexes with footfall.
Done this way, a branch and a flagship can both reach the top band, and the top band means the same thing in both: the customer’s vehicle was fixed properly by someone who checked their work.
Take this back to your network
Split your last cycle’s scores by main/branch and by full-format/service-only. If the gap is more than five points, run one simple test: remove every question that structurally cannot apply to the lower format and re-score. If half the gap disappears, your checklist is grading the building.
The audit that finds, the network that doesn’t fix
This is the number we would put in front of any two-wheeler leadership team before any other.
An audit produces two things: a score and a list. The score gets the attention. The list, meaning the corrective actions, each assigned to someone at the outlet with a due date, is what is supposed to change anything.
A mature two-wheeler programme generates a lot of list. Twenty to thirty findings per outlet per cycle is normal; across a large network that is tens of thousands of dated, evidenced tasks a quarter. Here is what typically happens to them.
Figure 5. Share of audit findings closed with evidence within 30 days. Illustrative ranges based on AutoSmart’s experience across segments.
In many two-wheeler networks, fewer than one finding in ten is closed with evidence by the time the next audit arrives, and a majority of open items are already past their due date. The best-performing regions in a network often close several times more than the worst. Small-town outlets and low-activity dealers close almost nothing. Findings that need money (a board, a tool, a demarcated bay) close at the same rate as findings that need only effort, which is to say they barely close at all.
Read that with the cost in mind. Every finding was produced by a trained auditor travelling to an outlet, spending half a day, photographing evidence and uploading it. The programme is expensive. And the output is a list that sits, largely unread, until the next auditor arrives and generates a fresh one.
My dealers get an action list with twenty-five items and no idea which three matter. So they do none of them and wait for the next audit.
National Service Head, two-wheeler brand
Why closure fails
- Volume without priority. Twenty-five items, all equal, all due in thirty days. A dealer principal with a small team looks at that list and rationally decides it cannot be done, so nothing is started. Three prioritised items would have been done.
- No owner above the outlet. The task is assigned to the service in-charge. Nobody at region level is measured on whether it closes. So the only person accountable is the person least able to fund the fix.
- Findings that need money, treated as if they need effort. Half of all open items are “not available.” These need a purchase decision. Sending the same finding again next quarter changes nothing.
- The score resets, the list does not. Next quarter the outlet is re-audited from scratch. It may score better because the auditor was different, or the day was quiet, or a temporary board went up. The old list is never reconciled against the new one, so nobody knows whether anything actually improved.
What good looks like
The networks with real closure, and we see four-wheeler and commercial-vehicle networks closing 70 to 80% of findings inside 30 days, share a small set of habits.
- Every finding is classified at source: quick fix, needs investment, needs people. Only quick fixes get a 30-day due date. Investment items go into a funded plan with the dealer. People items go to training.
- Each outlet gets a maximum of five priority actions per cycle, chosen by weight, not by count. The rest are logged but not chased.
- Regional managers are measured on closure rate, not outlet score. Score follows closure; it never leads it.
- Closure requires evidence, a photo, a document or a system screenshot, reviewed by someone who was not at the outlet. Self-declared closure is not closure.
- The next audit starts from the last list. The first question the auditor asks is whether the previous priorities were done. Improvement is measured against that, not against the network average.
Take this back to your network
Ask one question of your dealer standards team this week: of the findings raised last cycle, what share is closed with evidence today? If nobody can answer inside a day, your programme is producing reports, not improvement. If the answer is under 30%, you are spending your audit budget on documentation.
What senior leaders tell us
We spend most of our week with the people who run these networks. The same five things come up in almost every conversation, in every market.
- “The dashboard tells me where I stand. It does not tell me what to do.” A network score, a zone ranking and a top-band count are all backward-looking. Leaders want the three actions that would move the number, and most audit programmes do not produce them.
- “I trust the showroom audit more than the workshop audit.” Because the showroom standard is precise and physical (a display vehicle either is or is not on the floor) while the workshop standard is often a judgement call. Vague questions produce arguable results, and arguable results get ignored.
- “My best dealers hate the audit and my worst dealers ignore it.” Good dealers see an eighty-question checklist as a distraction from a business they already run well. Weak dealers have learned that nothing happens when they fail. The programme is not motivating the people it needs to.
- “Complaints are going up and scores are going up at the same time.” This is the experience gap in one sentence. It happens when the audit measures presentation and the customer experiences process.
- “Every quarter I get a different auditor and a different answer.” Consistency between auditors is the most underrated problem in the industry. If two auditors visiting the same outlet on the same day would not give the same score, the score is not a measurement. It is an opinion with a number attached.
The shift that is under way
The more forward-looking two-wheeler brands are moving in a direction that four-wheeler and commercial-vehicle networks moved in three to five years ago. The audit is becoming less of a quarterly event and more of a continuous system:
- Questions written so that the answer is binary and evidenced, meaning a photo, a document or a system record rather than a rating.
- Scores reported in layers, with the operational spine always visible on its own.
- Findings converted into a prioritised, owned, dated action plan at the outlet, tracked to closure with evidence, and rolled up so that regional leaders see closure rates alongside scores.
- Audit data joined to outcome data such as repeat-repair rate, complaint recurrence, review scores and post-warranty retention, so the brand can see which checkpoints actually predict customer behaviour and reweight accordingly.
- Dealer self-assessment between brand audits, on the same checklist, so that the brand visit verifies rather than discovers.
None of this is exotic. All of it is standard in four-wheeler retail. The two-wheeler industry is simply a few years behind, largely because its networks are bigger, its margins are thinner and its attention has been on the showroom.
A practical framework: reweighting the audit
Here is a way to restructure a two-wheeler dealer audit that we have seen work. It does not require a new checklist. It requires a different way of scoring the one you have.
Step one: classify every question
Put each question into one of four groups. Most checklists sort cleanly.
| Group | What it covers | Examples from a typical 2W checklist | Suggested weight |
|---|---|---|---|
| Process | Whether the work is done correctly | PDI records, final inspection, job allocation, torque & manual adherence, diagnostic report, estimate vs invoice, complaint closure & recurrence | 40% |
| Flow | Whether the outlet can handle its volume | Rush-hour handling, workshop zoning, accident-job tracking, bay utilisation, reminder & appointment discipline, back-order control | 25% |
| People | Whether the right people are present and trained | Manpower vs criteria, training records vs reality, supervisor availability, customer-relations executive, attitude & grooming | 20% |
| Presentation | How the outlet looks and feels | Signage, visual identity, lounge, amenities, displays, uniforms, delivery area, marketing material | 15% |
Notice what has happened. Presentation, which is typically half or more of the questions, now carries 15% of the score. Process and flow, which are typically a third of the questions, now carry 65%. An outlet cannot reach the top band on paint and lighting.
Step two: report the groups, not the total
The total score still exists, dealers and regional teams need a single number for ranking. But the four group scores travel with it everywhere it goes. A dashboard that shows an outlet at 80 also shows Process 62, Flow 70, People 84, Presentation 93. The conversation changes immediately.
Step three: make every question evidence-based
Rewrite any question an auditor could answer differently on a different day. “Is the workshop well organised?” becomes “Are the workshop zones physically demarcated? Photograph each.” “Is the final inspection done?” becomes “Show the last ten job cards. How many carry the supervisor’s inspection sign-off?” A question that produces a number and a photo cannot be argued with.
Step four: vary applicability and thresholds by format
Define once, for each question, whether it applies to sales-only, service-only and full-format outlets, and to main and branch. Define the threshold per city tier where footfall matters. Score each outlet against the questions that apply to it, so that its denominator reflects what it is, not what a flagship is.
Step five: cap and prioritise actions
Every failed question generates a finding, but at most five findings per outlet become priority actions for the cycle, selected by weight and then by cost to fix. Each has an owner at the outlet, an owner at the region, a due date and an evidence requirement. Closure rate on priority actions becomes a KPI for regional managers, reported next to score.
Step six: join audit data to outcome data
Once a network has two or three cycles of layered, evidenced data, join it to repeat-repair rate, complaint recurrence, online review scores and post-warranty retention at outlet level. The question to answer is simple: which checkpoints, when failed, predict a customer not coming back? Those get more weight next year. The ones that predict nothing get less. The audit becomes a model of customer behaviour, not a list of preferences.
What this looks like in practice
When a network moves from a flat checklist to this structure, the first cycle is uncomfortable: the network average usually drops several points, because the workshop is now visible. The dealers who complain loudest are typically the ones with the best showrooms and the weakest workshops. By the third cycle, closure on priority actions is usually several times higher than before, and the conversation at regional reviews has shifted from “what did you score” to “what did you fix”.
The 90-day plan
If you have read this far and recognised your own network, here is what to do in the next quarter. None of it needs a new system to start.
Days 1 to 30: see the gap
- Pull your last cycle’s results. Split every score into the four groups above and re-score. Report both the old total and the new group scores to leadership.
- Pull your top-ten failed questions. Confirm they are workshop process. Classify each as space, people or habit.
- Pull the corrective-action list. Calculate the closure rate with evidence. Report it.
- Split scores by main/branch and full-format/service-only. Quantify the format gap.
Days 31 to 60: change what is measured
- Rewrite every non-binary question so it produces a count or a photo.
- Set applicability by format. Remove structurally impossible questions from each format’s denominator.
- Agree the new weights with the service head, the sales head and the dealer council. Expect resistance from the dealers with the best showrooms.
- Define the five-priority-action rule and the evidence standard for closure.
Days 61 to 90: change who is accountable
- Add closure rate to regional managers’ scorecards. De-weight average outlet score.
- Run one audit cycle on the new structure. Report layered scores. Do not blend.
- For every “needs investment” finding, produce a dealer-level funded plan with dates. Stop re-raising these in the audit.
- Start the next cycle from the last cycle’s priority list. Measure improvement against it.
Ten things to take away
- An average score hides the outlets that matter. Report the share in the bottom band.
- Record sales and a loss-making workshop can coexist. Retention is the number that connects them.
- Every dealer audit is two audits: hospitality and process. Score them separately.
- The checkpoints that predict retention are the ones failing most and weighted least.
- Half of all failures are “not available.” That is a funding conversation, not an audit conversation.
- One checklist for every format grades the building, not the dealer.
- If you cannot state your closure rate today, your programme is producing reports.
- Five owned, dated, evidenced priorities beat twenty-five equal ones.
- Regional managers should be measured on closure, not score.
- The next audit should start from the last list, not from zero.
Methodology, references and about AutoSmart
Methodology
The published figures in this paper are drawn from the sources listed below. The ranges described as “illustrative” or “typical” reflect AutoSmart’s experience implementing and analysing dealer standards programmes across two-wheeler, passenger-vehicle and commercial-vehicle networks in India, the Middle East, Europe and South-East Asia. They are expressed as ranges, aggregated across multiple networks and programmes, and do not describe any single brand, network, dealer or audit cycle. Quotations are representative of conversations with senior network leaders and have been anonymised.
References
- Society of Indian Automobile Manufacturers (SIAM), “Auto Industry Performance of Q4 and FY 2025 to 26,” press release, April 2026.
- Business Standard, “FADA to seek OEM meetings as two-wheeler dealers flag workshop losses,” September 2026.
- Federation of Automobile Dealers Associations (FADA), Dealer Satisfaction Study 2026, press release, September 2026.
- Ken Research, “India Two-Wheeler Aftermarket Services Industry Outlook to 2027.”
- J.D. Power, 2017 and 2018 India Two-Wheeler Customer Service Index (2WCSI) Studies, press releases.
- J.D. Power, 2019 India Two-Wheeler Customer Service Index (2WCSI) Study, press release, July 2019.
About AutoSmart
AutoSmart builds the audit and dealer-performance platform used by automotive OEMs and distributors to run their dealer standards, warranty, process and customer-experience programmes. The platform covers the full loop this paper describes: evidence-based checklists configured by format and market, layered scoring, automatic conversion of findings into owned and dated action plans, closure tracking with evidence, and analytics that join audit results to outcomes. It is used across two-wheeler, passenger-vehicle and commercial-vehicle networks on four continents.
We work with dealer-development, service and quality leaders every day, and we wrote this paper because the same conversation keeps happening. If you would like to see how your own network splits across the four groups described in Section 7, we can usually show you within a week using your existing audit data.
© 2026 AutoSmart. This document may be shared freely with attribution. It may not be reproduced commercially without permission.