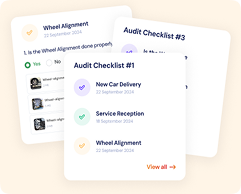
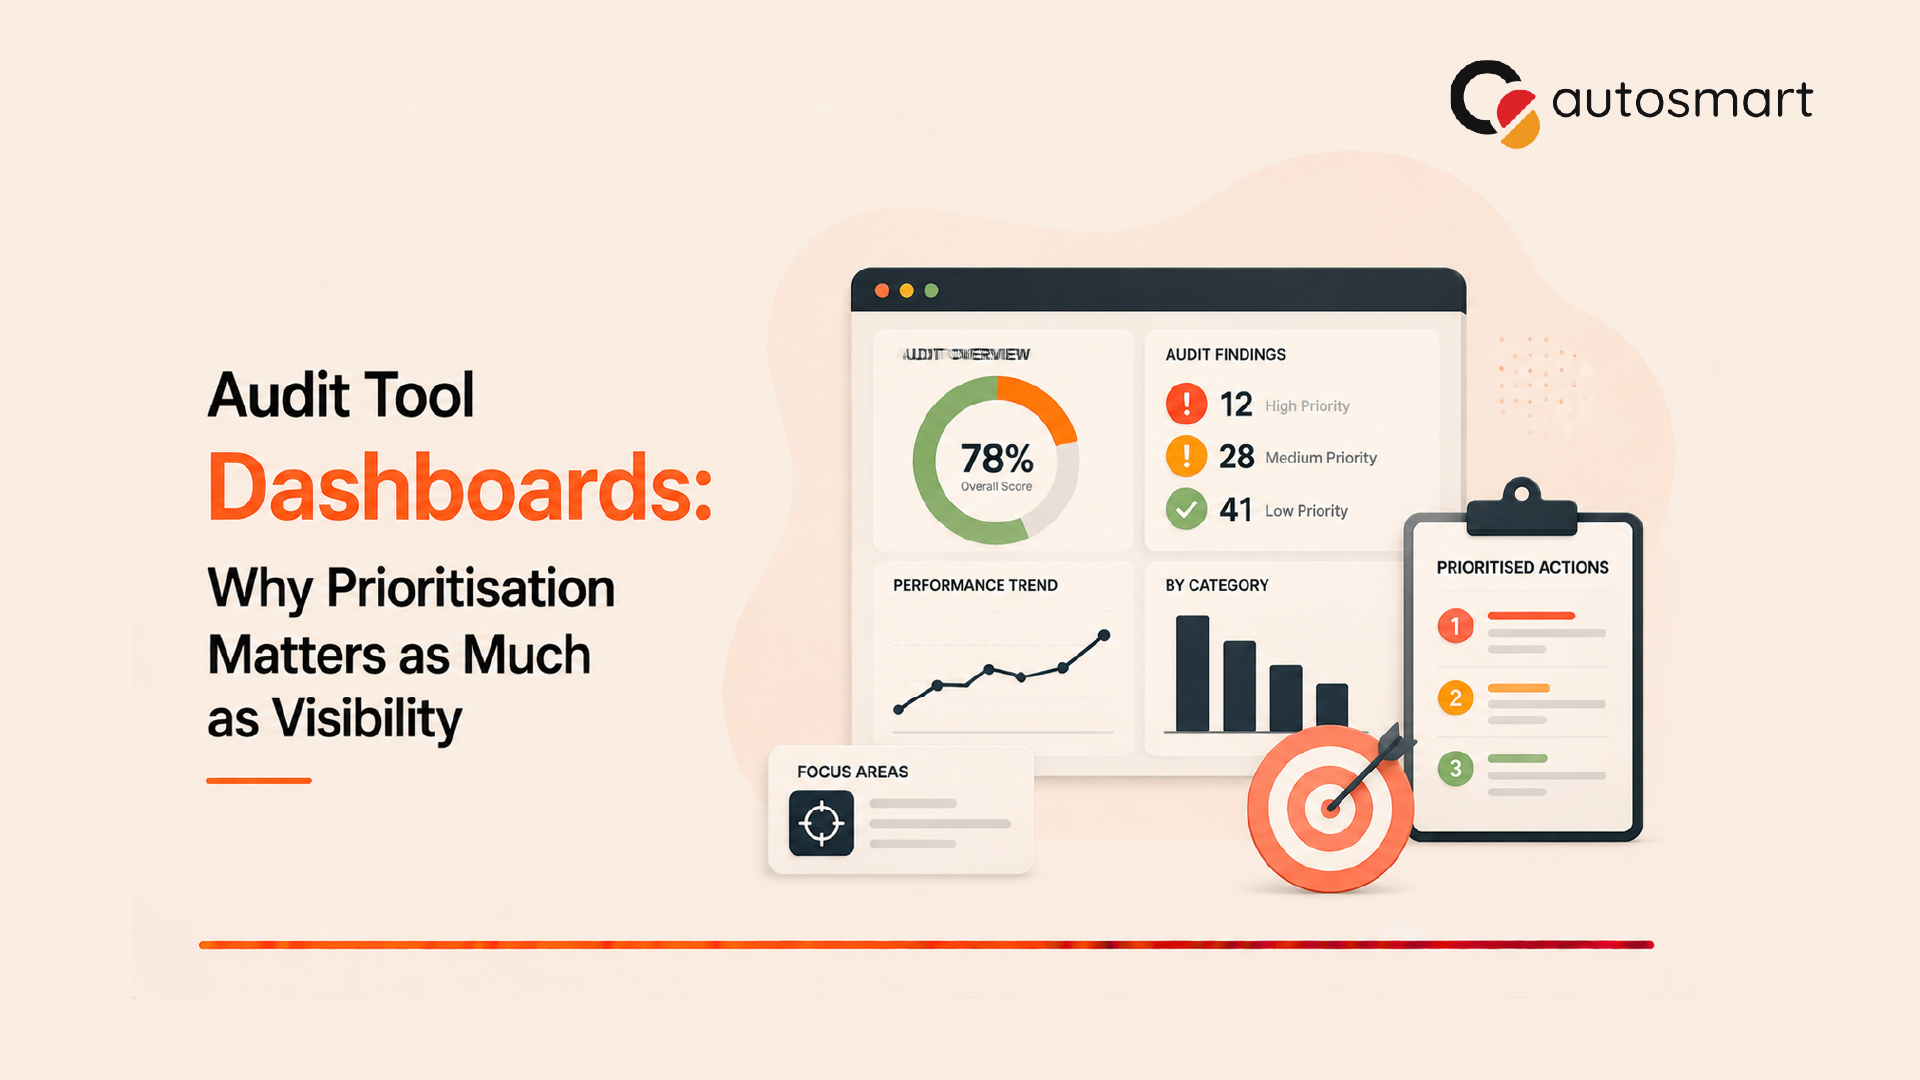
Open most dealership audit tool dashboards and you’ll see the same thing: scores by location, red and amber flags scattered across the network, a trend line or two. It’s a real step up from chasing paper reports, and at this point most networks running digital audits have it.
But once that dashboard loads and there are 80, 150, sometimes 300 open findings staring back, the actual question is simpler than the dashboard makes it feel: which one do you fix today?
Capturing the data isn’t the hard part anymore. Most platforms handle that well. The harder part, and the one worth slowing down on, is what happens between the dashboard loading and someone actually deciding where to send a technician or a follow-up call first.
Visibility Shows You Everything. It Doesn’t Tell You What Matters
A dashboard that lists every finding at every location is doing its job. That’s what a reporting tool is for. But “doing its job” and “telling you what to do next” aren’t the same thing, and the gap between them is where a lot of dealership audit programmes quietly lose momentum.
Take two findings sitting next to each other on the same screen, both flagged red. One is a fire extinguisher tag that’s a month out of date. The other is a safety issue that’s now shown up in three audit cycles in a row, at the dealership’s busiest service location. On the dashboard, nothing distinguishes them. A manager working top to bottom, or alphabetically, could easily clear the extinguisher tag first simply because it loaded above the recurring issue.
That’s the actual difference between visibility and prioritisation. Visibility means the finding got captured. Prioritisation means something in the system is helping decide which one needs a human looking at it right now.
What Actually Moves a Dashboard From “Showing” to “Ranking”
A handful of things separate a dashboard that lists findings from one that ranks them:
- Severity weighting: not just pass or fail, but a sense of how bad it gets if nobody touches it
- Recurrence tracking: a finding that’s shown up two or three cycles running gets treated differently from something new
- Location-level segmentation: being able to score and compare by branch, region, or outlet type instead of one flat network number
- Deadline proximity: overdue items pushed above ones that still have runway
Put those in place and the dashboard stops being a list you scroll through and starts behaving more like a queue. The things that need attention surface near the top instead of getting buried somewhere around row 140.
Why This Gets Harder, Not Easier, as a Network Grows
For one dealership, this barely matters. A service manager looking at five or six open items can eyeball which one’s worse without much help.
It falls apart at scale. An OEM running 80, 150, or several hundred locations isn’t dealing with five findings, they’re dealing with hundreds, spread across safety, sales process, facility standards, and environmental compliance all at once. Nobody is sorting that by hand reliably, week after week. Either the dashboard does the ranking, or it doesn’t happen at all.
This is part of why the same findings tend to come back. A gap documented during a facility audit, or flagged through CAPA tracking, can sit unresolved for months not because nobody noticed, but because it was one row among three hundred and nothing pulled it out as urgent.
What Has to Be Built In Before Any of This Works
A few pieces need to exist underneath the dashboard for ranking to be possible at all.
Severity has to get tagged at the moment the auditor logs the finding, critical, major, or minor, right there on the floor. If that classification only gets added later in a review step, the dashboard is already working with half the picture.
Findings need to carry their own history with them. A problem that’s shown up once and a problem that’s shown up three times in a row look identical on a checklist, but they’re not the same problem. Storing that history alongside the current result is what lets a repeat finding get flagged on its own, instead of relying on someone remembering the last report.
Ownership has to be attached to the finding itself, not the department. A Person-in-Charge structure, where every flagged item has one named person and a deadline next to it, gives the dashboard something concrete to check against when deciding what’s overdue.
And the filters need to go past “show me dealership X.” Severity, days overdue, recurrence count, these all need to be filterable on their own so the worst items surface regardless of which location happens to own them.
A Quick Example
Picture a network with 80 dealerships running quarterly facility audits. After one cycle closes, the dashboard might be sitting on 300 open findings. Sorted by location alone, that’s 300 separate rows for a regional team to wade through in whatever order the system happened to load them.
Layer in prioritisation and the same 300 findings can come back looking more like this:
- Critical findings that are already past their deadline
- Anything that’s recurred for two cycles or more
- Findings at locations with a history of customer complaints tied to a similar issue
- Everything else, grouped by category, for the normal follow-up cycle
The work itself hasn’t shrunk. What’s changed is which three or four things someone deals with on Monday morning instead of guessing.
The Part That Actually Affects the Business
Dealer standard compliance has a real, measurable relationship with revenue and franchise standing, and which findings get closed first is part of what shapes that over a year, not just which findings exist. A dashboard that pushes attention toward the highest-risk items first is doing more for that outcome than one that leaves the order up to whoever happens to open the report.
It changes how field teams actually spend their week, too. A regional manager working off a ranked view can plan a week of site visits around the worst open items across a territory. Without that, the same manager is rebuilding that picture from memory or from a half-remembered conversation with the last auditor, every single time.

Siddharth works in the Founders’ Office at AutoSmart, where he covers strategy, research, and revenue operations. He writes about warranty audits, compliance frameworks, and what the data across audit programmes actually shows.