In the automotive industry, maintaining consistent quality and compliance across dealerships is a big challenge. AutoSmart Audit is built precisely for this: to help automotive businesses standardize and streamline their dealer audits, compliance checks, and operational inspections. By applying data visualization, businesses can make audit results far more actionable, insightful, and aligned with business goals.
Why Data Visualization Matters for Dealer Audits
Simplifying Complex Audit Data
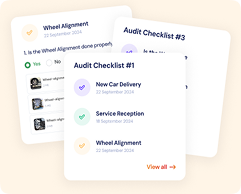
AutoSmart Audit captures a wide variety of audit information: from operational checklists and facility inspections to compliance ratings, photos, and corrective-action assignments. Presenting all this in raw tables or spreadsheets can be overwhelming. With data visualization, key metrics such as pass/fail rates, audit scores, and non-conformance counts become immediately clearer. Visual dashboards help decision-makers quickly spot where performance is strong and where corrective action is needed.
Identifying Patterns and Trends Over Time
One of AutoSmart Audit’s strengths is its ability to show audit results from multiple visits, across locations, and over time. Through visual representations like trend lines or simple charts, recurring issues become glaringly obvious. For example, if a particular site repeatedly fails the same checklist item, or if compliance improves after an action plan, trends emerge in the data. Such insights help management understand root causes, whether it’s training gaps or process breakdowns.
Improving Cross-Team Communication
Audit data is relevant not just to auditors; regional managers, operations teams, and quality leaders all need to access and act on it. Visual dashboards reduce ambiguity: everyone sees the same data, displayed in intuitive form. Whether you’re looking at a site’s audit scorecard, its list of open action items, or photographic evidence of non-conformance, visualization ensures that all teams can interpret results consistently and efficiently.
Accelerating Smart Decision-Making
Because AutoSmart Audit supports real-time data capture, visual dashboards can reflect up-to-date findings. When audit data is collected via the mobile app (even offline) and synchronized, management can instantly observe emerging risks or compliance failures. This immediacy empowers leaders to respond faster: assigning corrective actions, escalating urgent issues, or re-prioritizing audit frequency, all based on current, data-driven insight.
What Kinds of Visualization Techniques Work Well with Dealer Audits
Comparative Bar and Line Charts
Bar and line charts are ideal for comparing audit performance across different dealerships or over time. For instance, a bar chart might compare monthly average scores across all sites, while a line chart shows how a single site’s score evolves. AutoSmart Audit’s dashboard likely supports these kinds of visuals naturally, helping you benchmark performance and drive improvement.
Scorecards and KPI Gauges
Instead of relying on raw numbers, visual scorecards or gauge-style charts can show how each dealership is doing against predefined KPIs (audit compliance, action resolution rate, site cleanliness, safety). AutoSmart Audit’s customizable checklist and evaluation engine means you can define these KPIs in the system, then display them visually to highlight strengths and weaknesses.
Trend Views
While AutoSmart Audit emphasizes real-time dashboards and analytics, visualizing performance across multiple sites or audit categories helps you immediately identify clusters of underperformance. For example, you could use a coloured layout in your internal dashboard to flag which locations most frequently fail on specific criteria (safety, facility maintenance, quality).
Interactive Dashboards
A core part of AutoSmart Audit’s appeal is its unified platform. Its dashboard aggregates audit data from across your operations, and you can filter by checklist type, location, time period, or auditor. This interactivity lets stakeholders drill down into specific areas, such as opening a view that shows only audits with open action items, or filtering to view just critical compliance violations.
How AutoSmart Audit’s Digital Architecture Supports Visualization
Real-Time Data Capture
AutoSmart Audit enables auditors to submit their findings via a mobile app. That means audit data (including photos and comments) is collected live and synced to the central system. This immediately feeds into the visual dashboards, keeping them up to date with minimal delay.
Customizable Checklists and Templates
Because AutoSmart Audit allows fully customizable audit checklists, you can tailor your data capture to your exact quality standards, operational procedures, or brand requirements. Once you define what you want to measure, you can build visuals around those very KPIs, whether they are safety compliance, facility cleanliness, or service bay standards.
Action-Plan Integration and Accountability
AutoSmart Audit supports creating action plans from failed audit items, assigning them to individuals, and tracking their resolution. A visual dashboard can display unresolved issues, who’s responsible, and how long they’ve been open. This makes accountability transparent and encourages timely follow-through.
Standardization Across Locations
One of AutoSmart Audit’s key benefits is standardizing audit processes across multiple locations. By using the same checklist and evaluation criteria everywhere, the resulting visual reports are comparable across sites. This consistency strengthens regional or national oversight and helps identify best practices or problem areas.
Offline Capability and Mobile Access
Auditors can use AutoSmart Audit even in areas without the internet, and later sync their data. This flexibility ensures that data visualization remains grounded in real, on-site observations, and not limited by connectivity.
Impact of Data Visualization in AutoSmart Audit
Better Efficiency
By using visual dashboards, managers can reduce the time they spend manually aggregating and interpreting audit reports. Live charts and scorecards mean faster insights, less manual data crunching, and more time spent on strategy.
Improved Quality and Compliance
Visualization helps you monitor compliance trends (for example, repeating failures in safety items, or 5S checks), so that issues are not just noted, they’re acted upon. With the assignment of corrective tasks and ongoing tracking, the quality of audits can improve continuously.
Greater Transparency and Accountability
When audit findings and action plans are displayed visually, all stakeholders, from local dealers to corporate quality teams gain full visibility. This transparency ensures that failed audit items are not forgotten, and responsible individuals are clearly identified.
Data-Driven Continuous Improvement
Over time, recurring patterns in your dashboards can reveal root causes, process bottlenecks, or systemic risks. Rather than reacting to each audit in isolation, you can make strategic decisions: perhaps you need more frequent audits in certain locations, updated training in specific checklist categories, or a re-evaluation of your operational standards.
Scalability Across Multiple Sites
As your network of dealerships grows, AutoSmart Audit’s unified platform and visual data reporting make it easy to scale. Because the system standardizes audit workflows and centralizes results, you can maintain quality and consistency even as complexity increases.
Conclusion
Thus, AutoSmart Audit provides real-time, digital, mobile-enabled audit workflows tailored for automotive dealer audit software and facility inspections. It supports custom checklists, action plans, offline mobile audits, and live dashboards: all of which make data visualization not just useful, but central to the value proposition.
By integrating intuitive visual reporting into AutoSmart Audit, automotive businesses can move beyond static spreadsheets to actionable intelligence: identifying risk, driving continuous improvement, and aligning teams across multiple locations. Visualization is not merely decorative, it is a strategic tool for driving the audit program forward, improving compliance, efficiency, and operational quality across the dealer network.

Naseef Umar is the Founder & CEO of AutoSmart Technology, a SaaS platform digitizing audits for OEMs, distributors, and dealer networks. With prior experience at Toyota (Abdul Latif Jameel) and a background in IT and Industrial Management, he writes about audits, operational discipline, and building SaaS products for enterprise customers across markets.