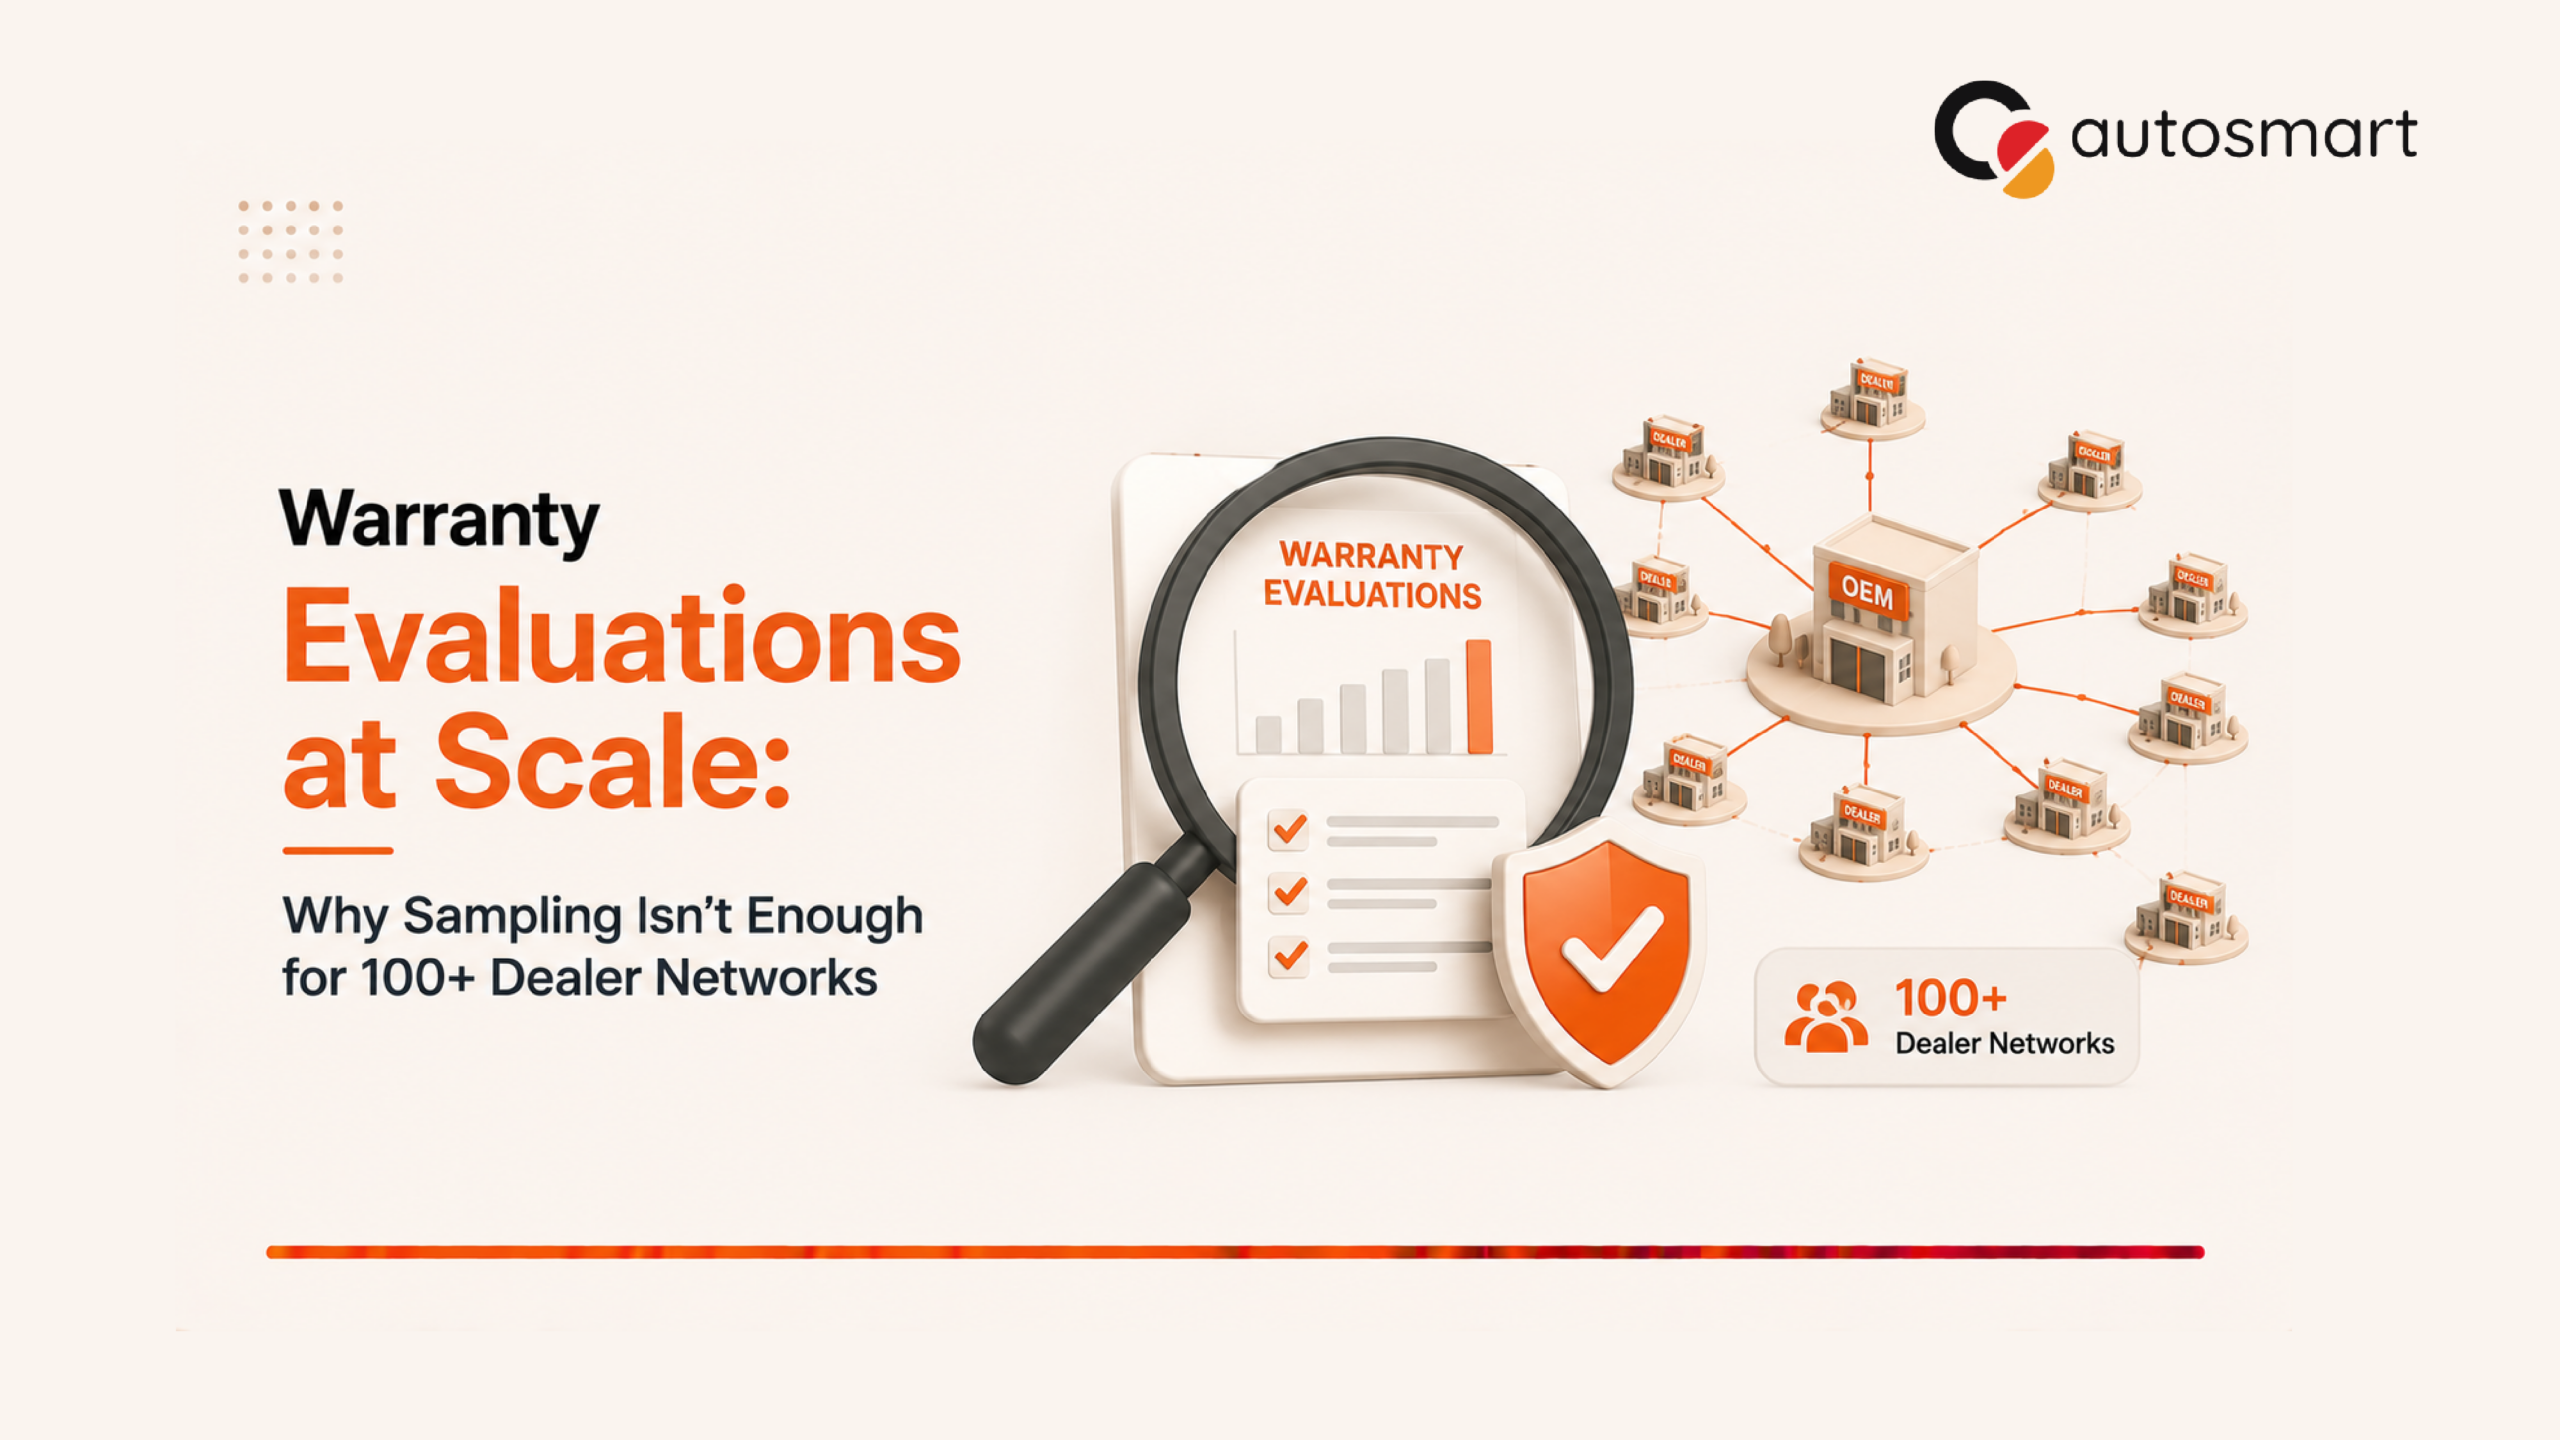
Ask most OEM warranty teams how they cover their dealer network and the honest answer is some version of sampling: a percentage of claims reviewed each month, weighted maybe toward higher-value repairs, rotated across dealerships over time. At a small network, that’s a reasonable trade-off. At 100+ dealerships, it stops being a trade-off and starts being a blind spot with a percentage attached to it.
The math is the problem. If a warranty team reviews 10% of claims and a dealership knows, even informally, that review rates sit somewhere in that range, the incentive to keep problems inside the unreviewed 90% doesn’t require anyone to be malicious — it just requires the sampling gap to exist.
Why Sampling Made Sense in the First Place
Sampling isn’t a bad idea on its own. Reviewing every claim manually, in detail, was never realistic for a warranty team of any reasonable size once claim volume passed a certain point. Sampling was the practical answer to a resourcing problem: limited reviewers, limited hours, a claim volume that outpaces both.
The issue isn’t that sampling was chosen. It’s that sampling was chosen as a permanent strategy rather than a stopgap — and it stayed in place well past the point where the network size it was designed for had changed.
What Breaks Down Specifically at 100+ Dealerships
A few things happen once a network crosses into this range that a smaller network doesn’t have to deal with:
Claim volume outpaces reviewer capacity by an order of magnitude. The gap between what should be reviewed and what can be reviewed manually widens every quarter the network grows, without the review team growing at the same rate.
Patterns get diluted across more locations. A recurring issue that would stand out clearly across 10 dealerships gets statistically buried across 150 — the same underlying pattern, but harder to see because it’s spread thinner.
Dealer-to-dealer comparison becomes unmanageable by hand. Knowing which dealerships are consistently flagged versus which are clean requires cross-referencing hundreds of evaluation histories — not something a review team can hold in their heads or a spreadsheet at that scale.
Regional and OEM-level reporting gets harder to trust. Aggregate warranty health numbers built from a sample start to reflect the sample’s blind spots more than the network’s actual condition.
What a Full-Coverage Warranty Evaluation Model Looks Like
The alternative to sampling isn’t necessarily “review every claim in full manual detail” — that’s not realistic either. It’s building a model where every claim gets checked against a consistent set of criteria automatically, and only the ones that trigger a flag get pulled for deeper manual review. A few components make that possible:
- Automated first-pass evaluation on every claim — checking job card consistency, labor time, and parts usage against standard baselines, without requiring manual review of each one.
- Risk-based escalation — claims that pass the automated check move through; claims that don’t get routed to a human reviewer.
- Dealer-level and network-level pattern tracking — so recurrence and drift are visible across the whole network, not just within whatever slice got sampled.
- Severity tiering — treating a claim with a large deviation differently from one with a minor, likely-explainable one.
- Consistent criteria across dealerships — so evaluation isn’t dependent on which reviewer happened to get assigned which region.
Why This Isn’t Just a Bigger Version of the Same Process
It’s tempting to think scaling warranty evaluation just means hiring more reviewers to sample more claims. That doesn’t solve the underlying issue — it just makes the sample larger while the gap, proportionally, stays the same. The actual shift needed is structural: moving from “a person decides which claims to check” to “every claim gets checked automatically, and a person decides what to do with the ones that get flagged.” That’s a different model, not a scaled-up version of the old one.
What This Means for Warranty Budget Accuracy
Sampling doesn’t just risk missing fraud — it distorts the OEM’s own picture of warranty health. A network’s reported warranty cost trends, dealer scorecards, and budget forecasts are all built on whatever data got reviewed. If that data is a 10% sample, the OEM isn’t managing warranty cost based on reality — it’s managing it based on a slice of reality, and hoping the slice is representative. At 100+ dealerships, that’s a large assumption to be resting a budget line on.