
















Overview
What is an audit reporting dashboard?
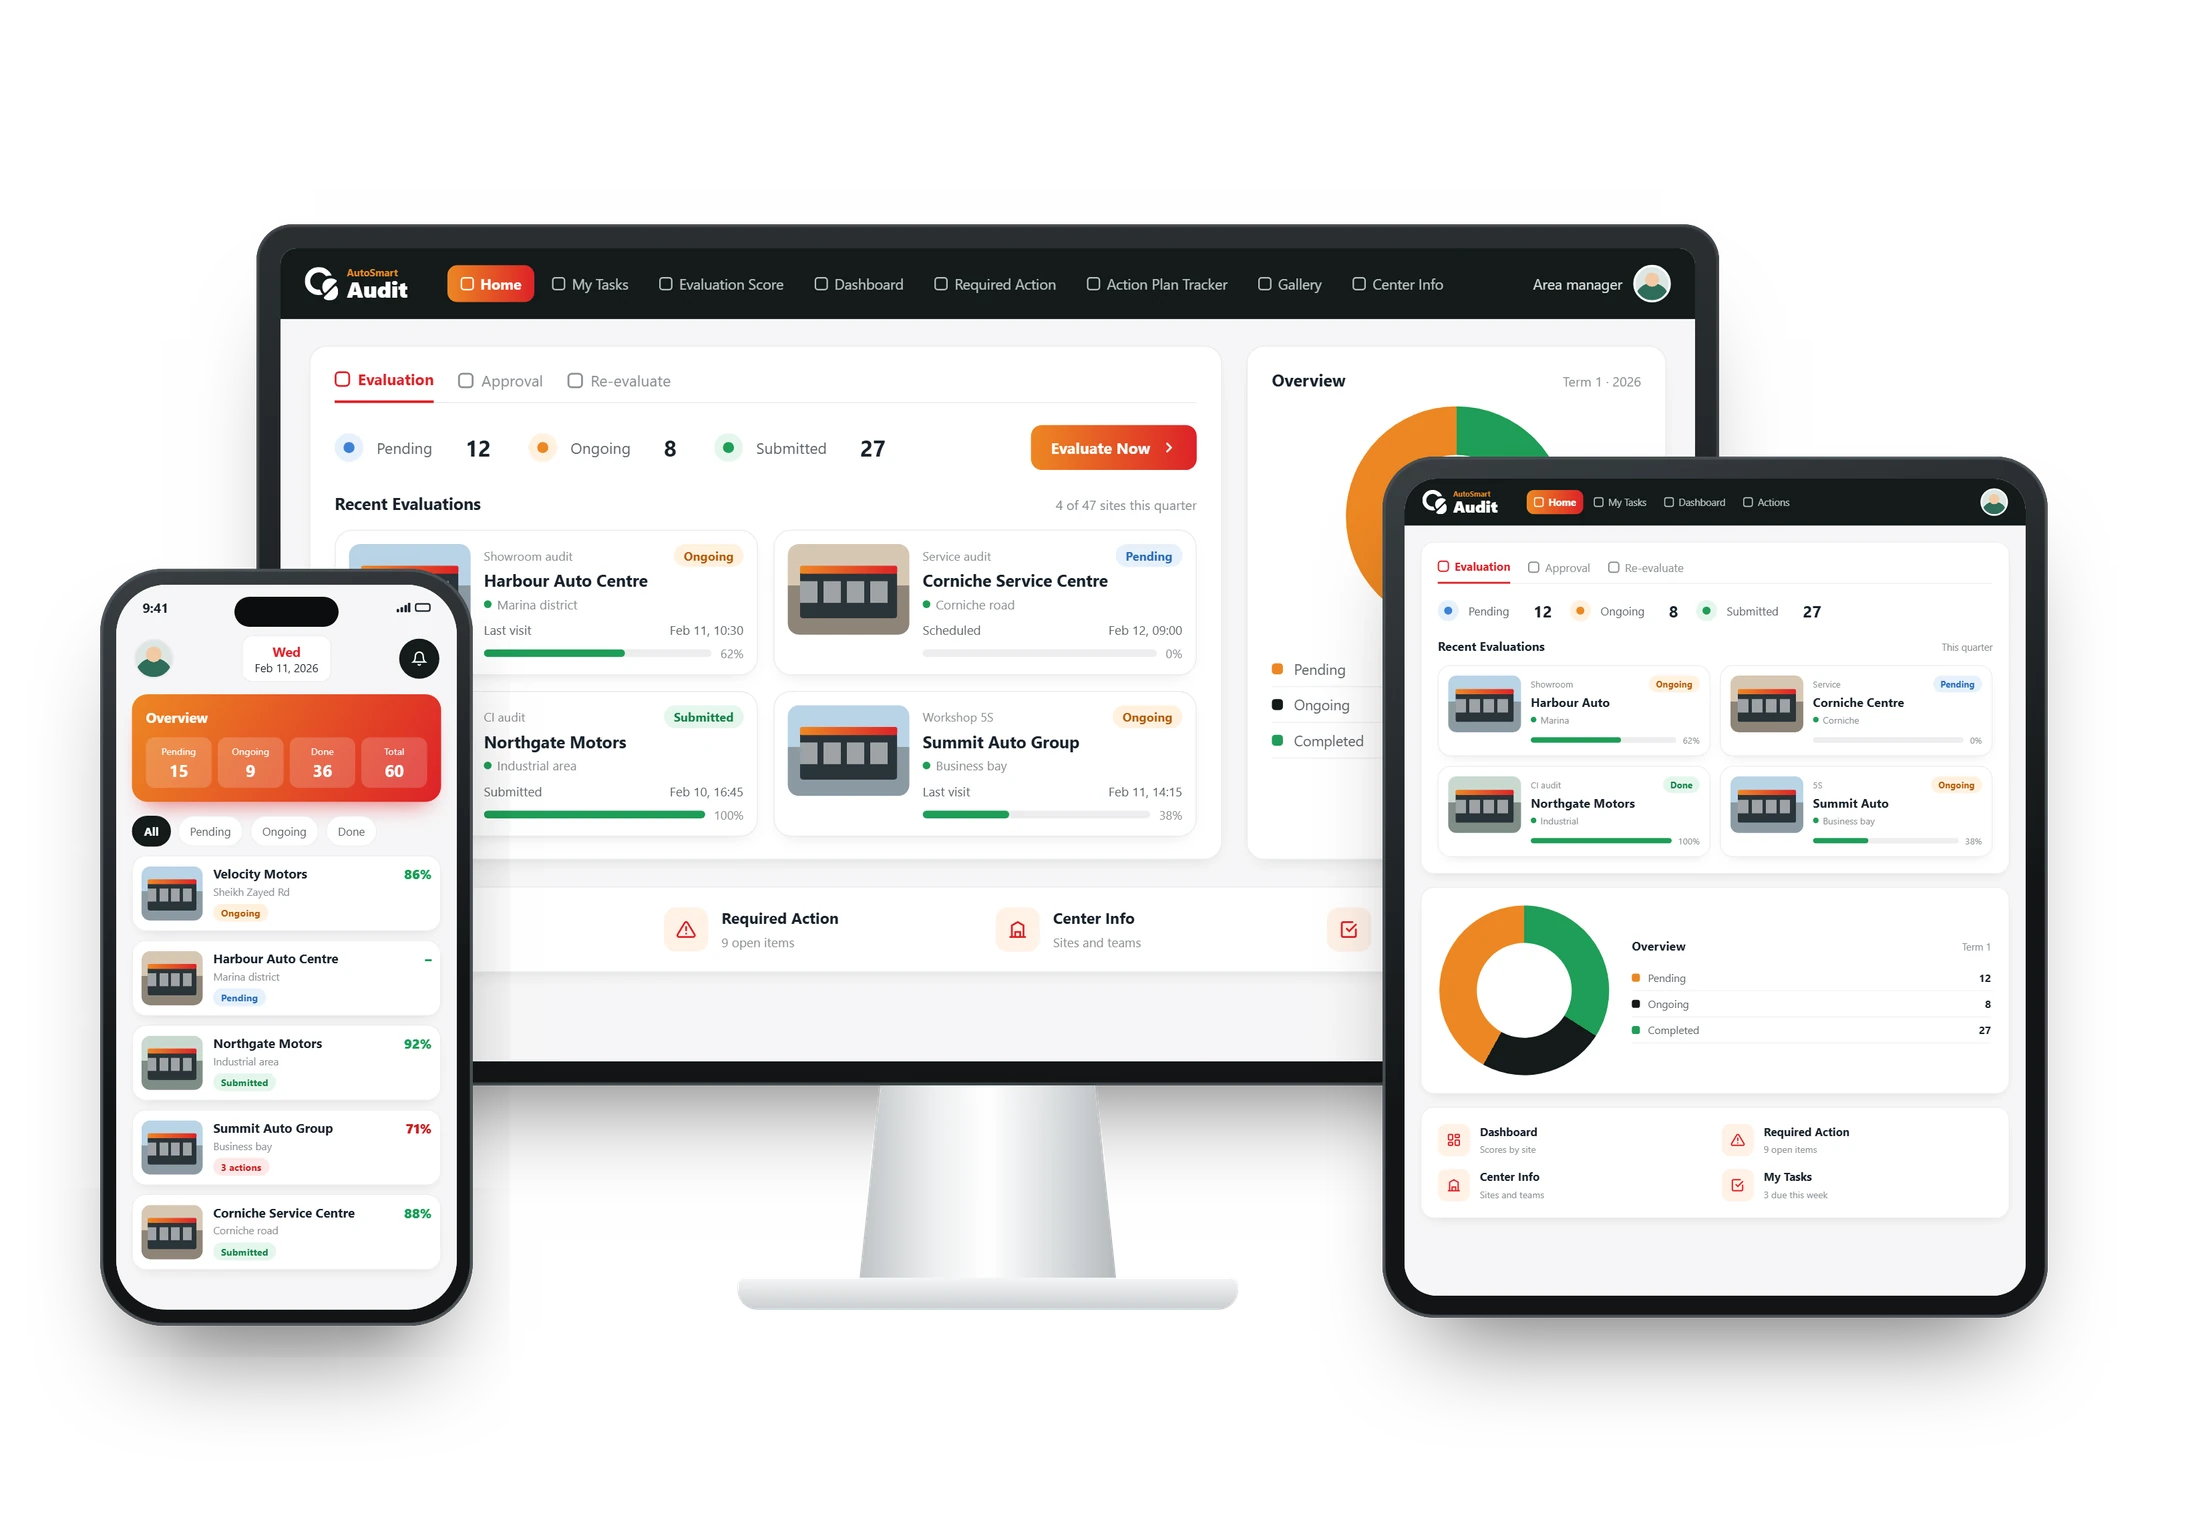
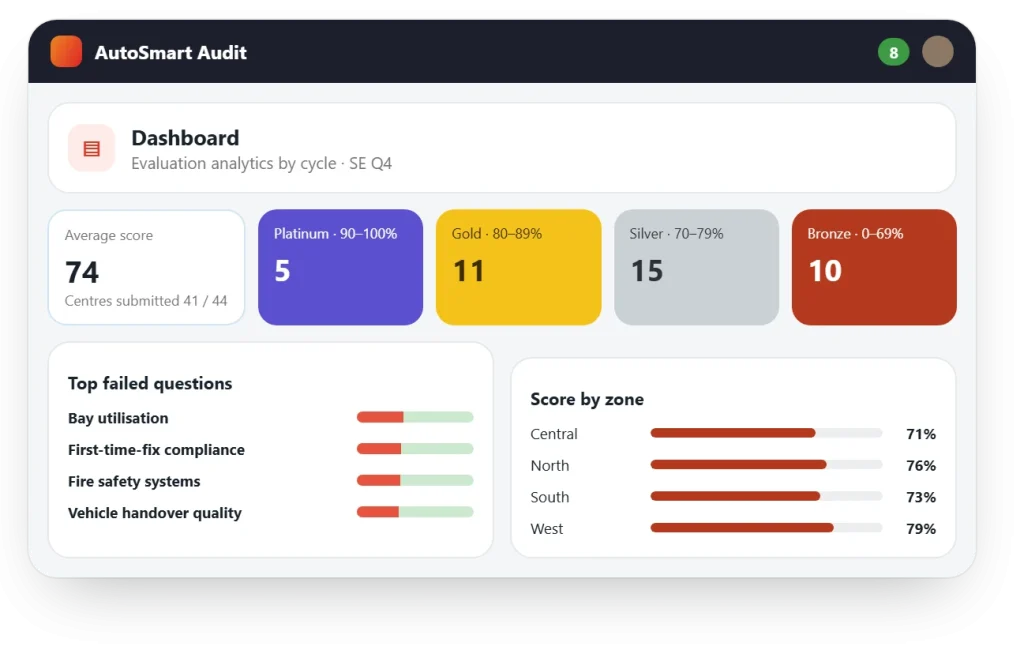
An audit reporting dashboard shows audit results for the whole network in one place. In AutoSmart scores, compliance rates, failed items and open actions arrive as each audit is submitted, so you can compare sites, regions and periods without waiting for reports to be compiled.
At a glance
Included in Visit reports and exports on every plan; the dashboard from Growth
Where The AutoSmart dashboard
Exports PDF and Excel
Results
Results from AutoSmart customers
85%
Less time per facility audit at MG Motors MEA, down from 5–7 days to 1
Key capabilities
The whole network, as audits come in
Leadership reads the same live numbers the audit team works from.
Capability 1
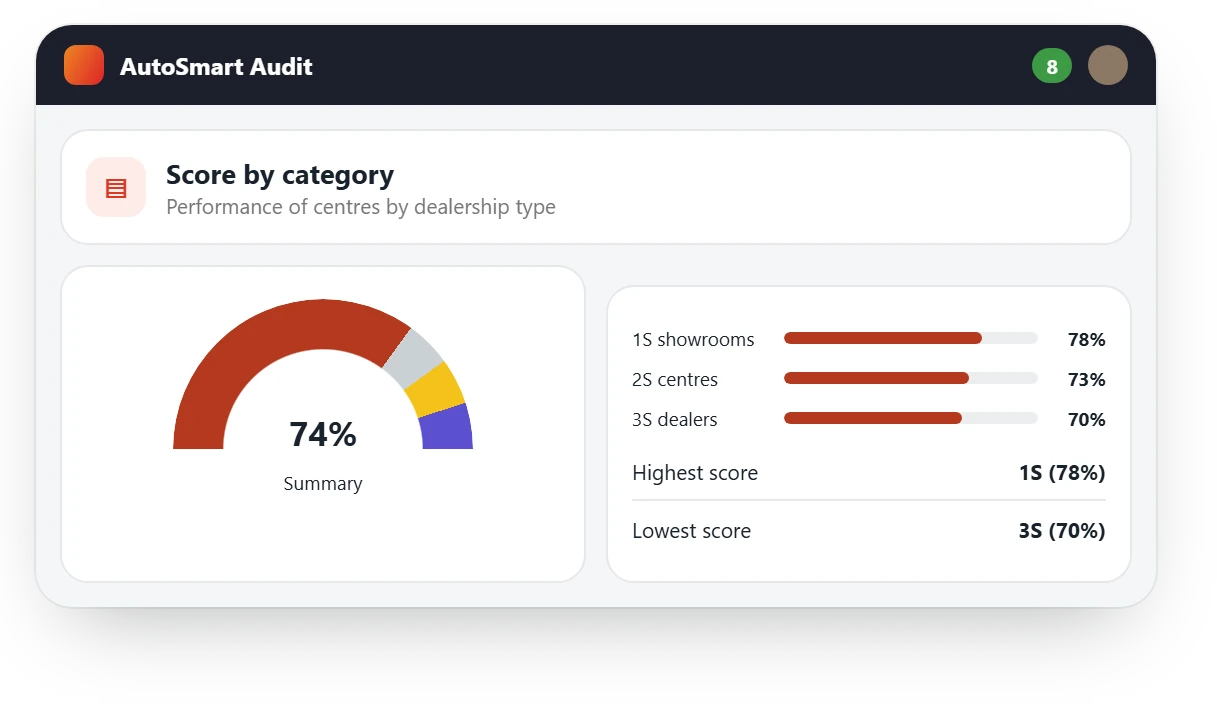
Live scores for every site
Scores, compliance rates and open actions reach the dashboard the moment each audit is submitted, by site, region and standard.
- Network-wide overview
- Sites by grade, score by region
- Open actions per site
Capability 2
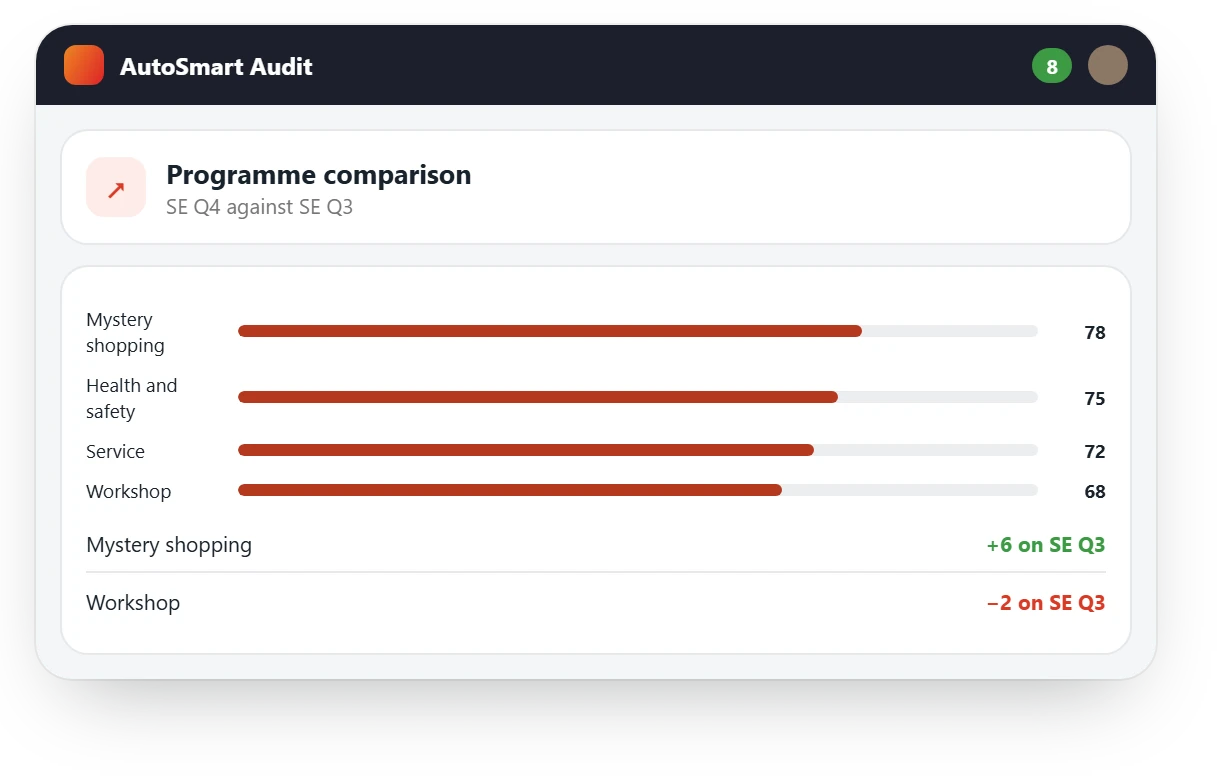
See what fails and what improves
Spot the standards that fail most often and compare performance month on month, quarter on quarter or across past evaluation cycles.
- Top failed questions and trends
- Period and cycle comparison
- Split by brand, region or outlet type
Capability 3
Reports that go out on their own
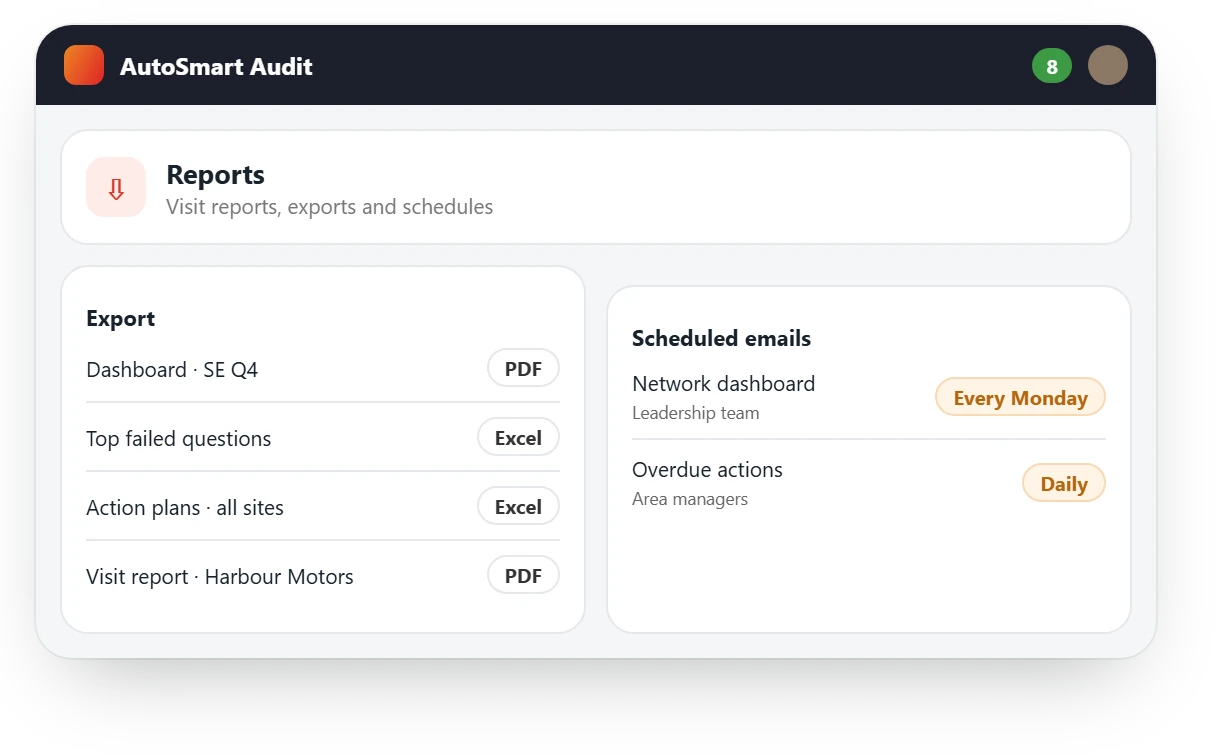
Every audit ends with a shareable visit report. Export results to PDF or Excel, and email dashboards and reports to leadership on a schedule.
- Automatic visit reports
- PDF and Excel exports
- Scheduled report emails
What’s included
Everything in dashboards and reports
See
- Management dashboard (Growth)
- Top failed questions and trends (Growth)
- Your own grade bands
Compare
- Month on month and quarter on quarter
- Historical cycle comparison (Growth)
- By brand, region or outlet type
Share
- Dealer visit reports on every plan
- Excel and PDF exports on every plan
- Scheduled report distribution (Growth)
Where it’s used
Where teams report from the dashboard
FAQ
Audit reporting dashboard: common questions
What is an audit reporting dashboard?
One view of audit results across the network. In AutoSmart scores, failed items and open actions appear as each audit is submitted.
Can we compare periods?
Yes. Compare month on month or quarter on quarter, and compare a site’s performance across past evaluation cycles.
Can we use our own grades?
Yes. Define your own score bands, for example 91–100 Gold, and split results by brand, location, region or outlet type.
How do reports reach leadership?
Reports can be exported as PDF or Excel, and from the Growth plan dashboards and reports can be emailed to leadership on a schedule.
Can we use the data in our own reporting tools?
Yes. All data can be exported for use in BI platforms, data warehouses or other reporting systems.